

The 2020 Presidential election was one for the history books, in many, many ways. While we await final precinct-level results I thought it would be informative to see the results mapped by various political districts. I have mapped the results below by county supervisor, state senate, and state assembly districts, as well as by the nine Coachella Valley cities. Any districts that overlap Riverside County were included. The results displayed are the percentage of votes for Biden or Trump as compared to their vote totals combined. Third-party and write-in candidates are not part of the totals.
The final results for Riverside County were: Biden 54% and Trump 46% (as compared to Biden 53% vs Trump 45% of all presidential candidate votes).
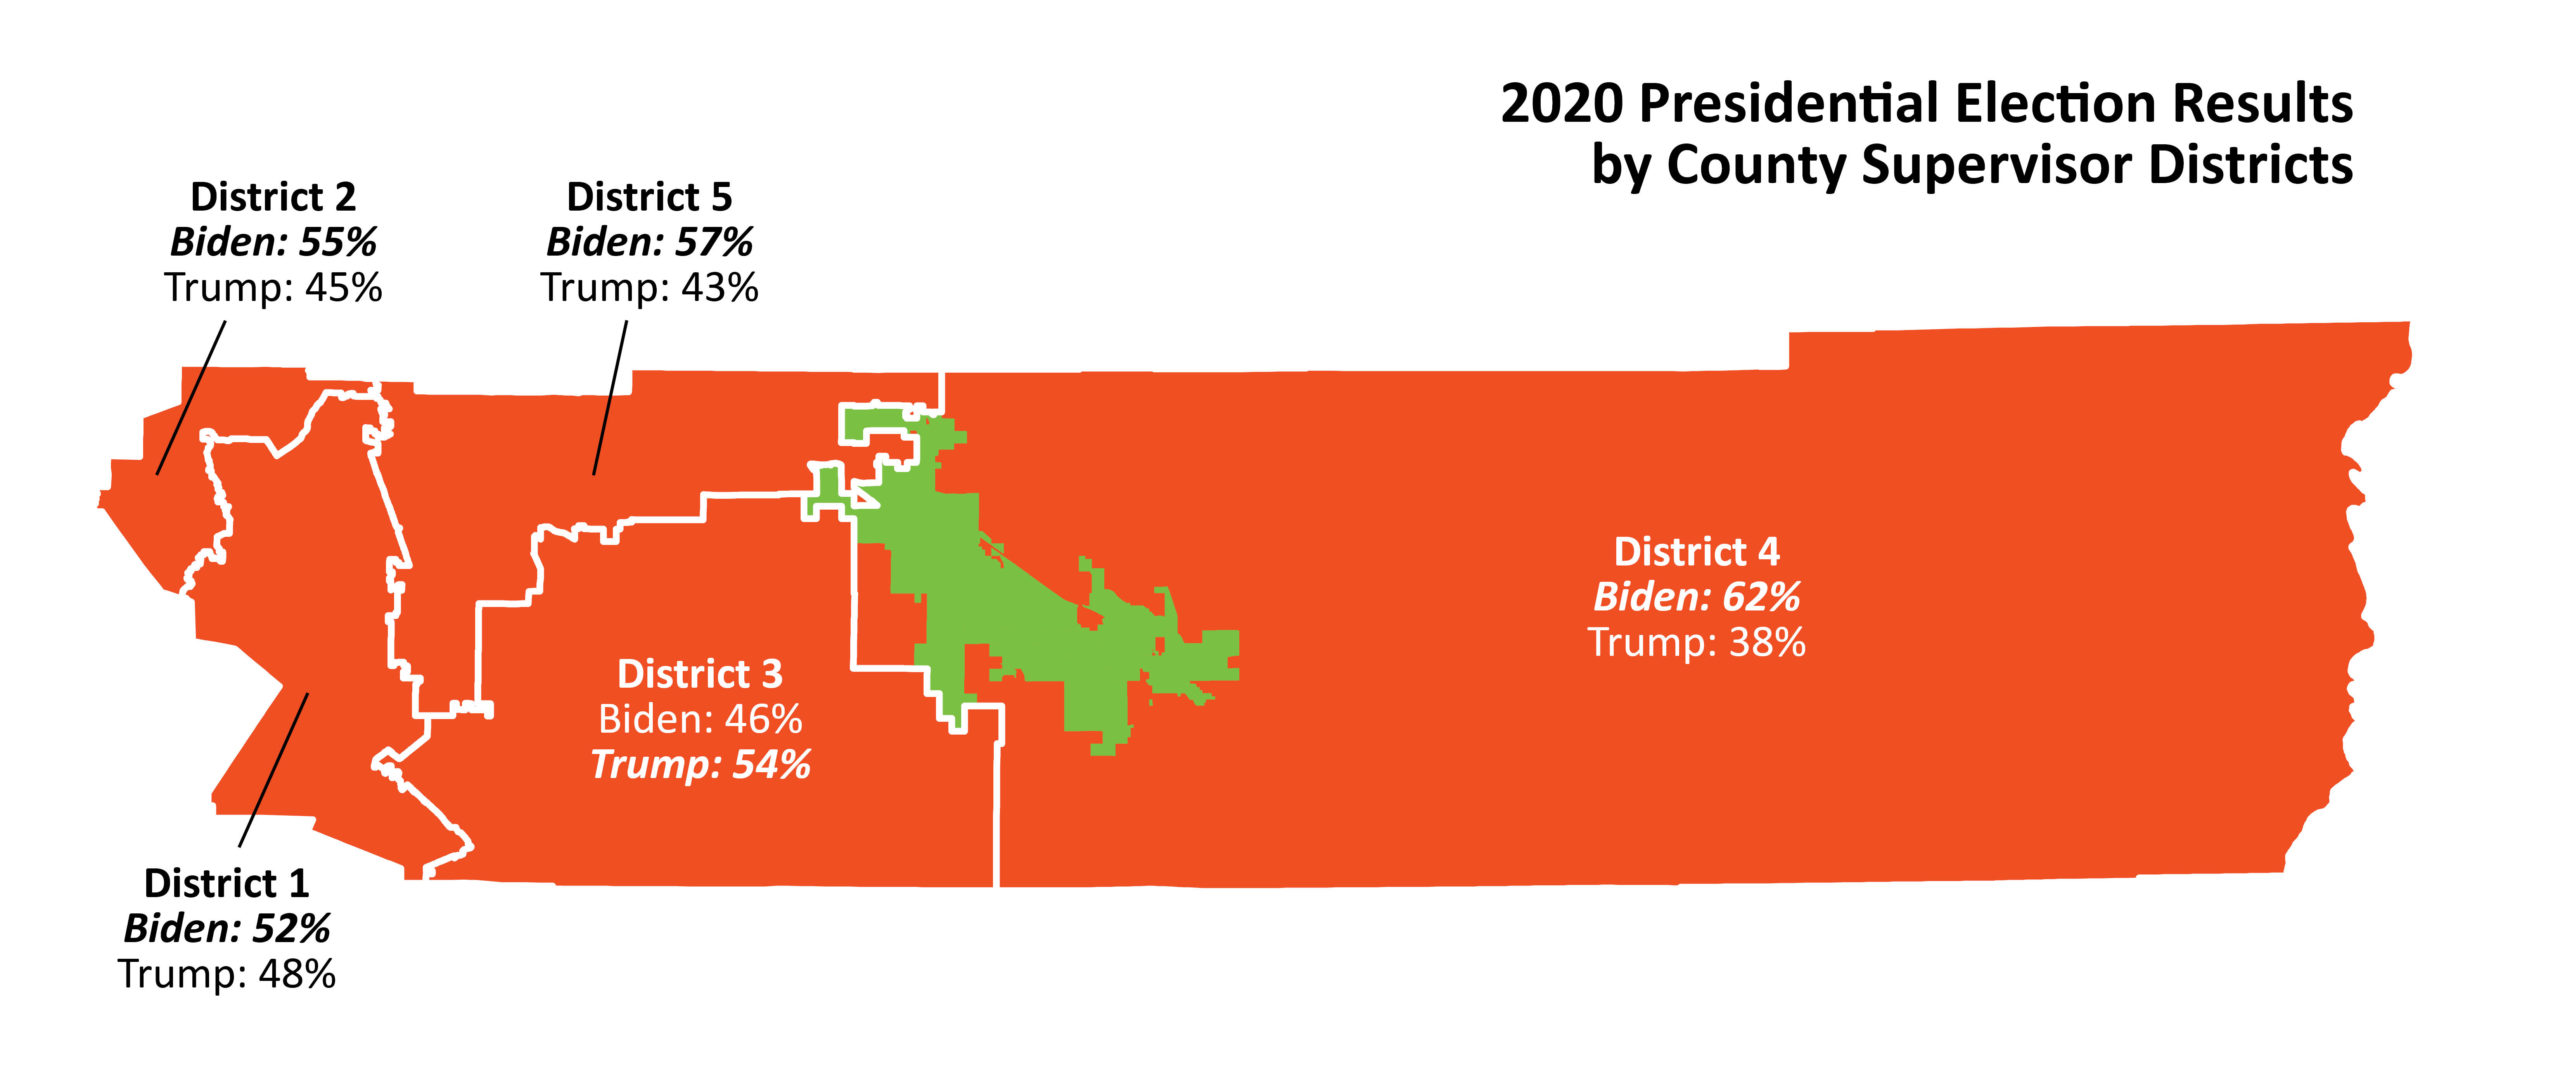
For County supervisor districts, our district 4 saw the highest percentage for Biden – 62%. Just to our west, District 3 saw the highest percentage for Trump, 54%.
As compared to the county supervisor boundaries, our state senate district 28 widens to the west adding more Trump voters and thus lowering the Biden lead to 52%.

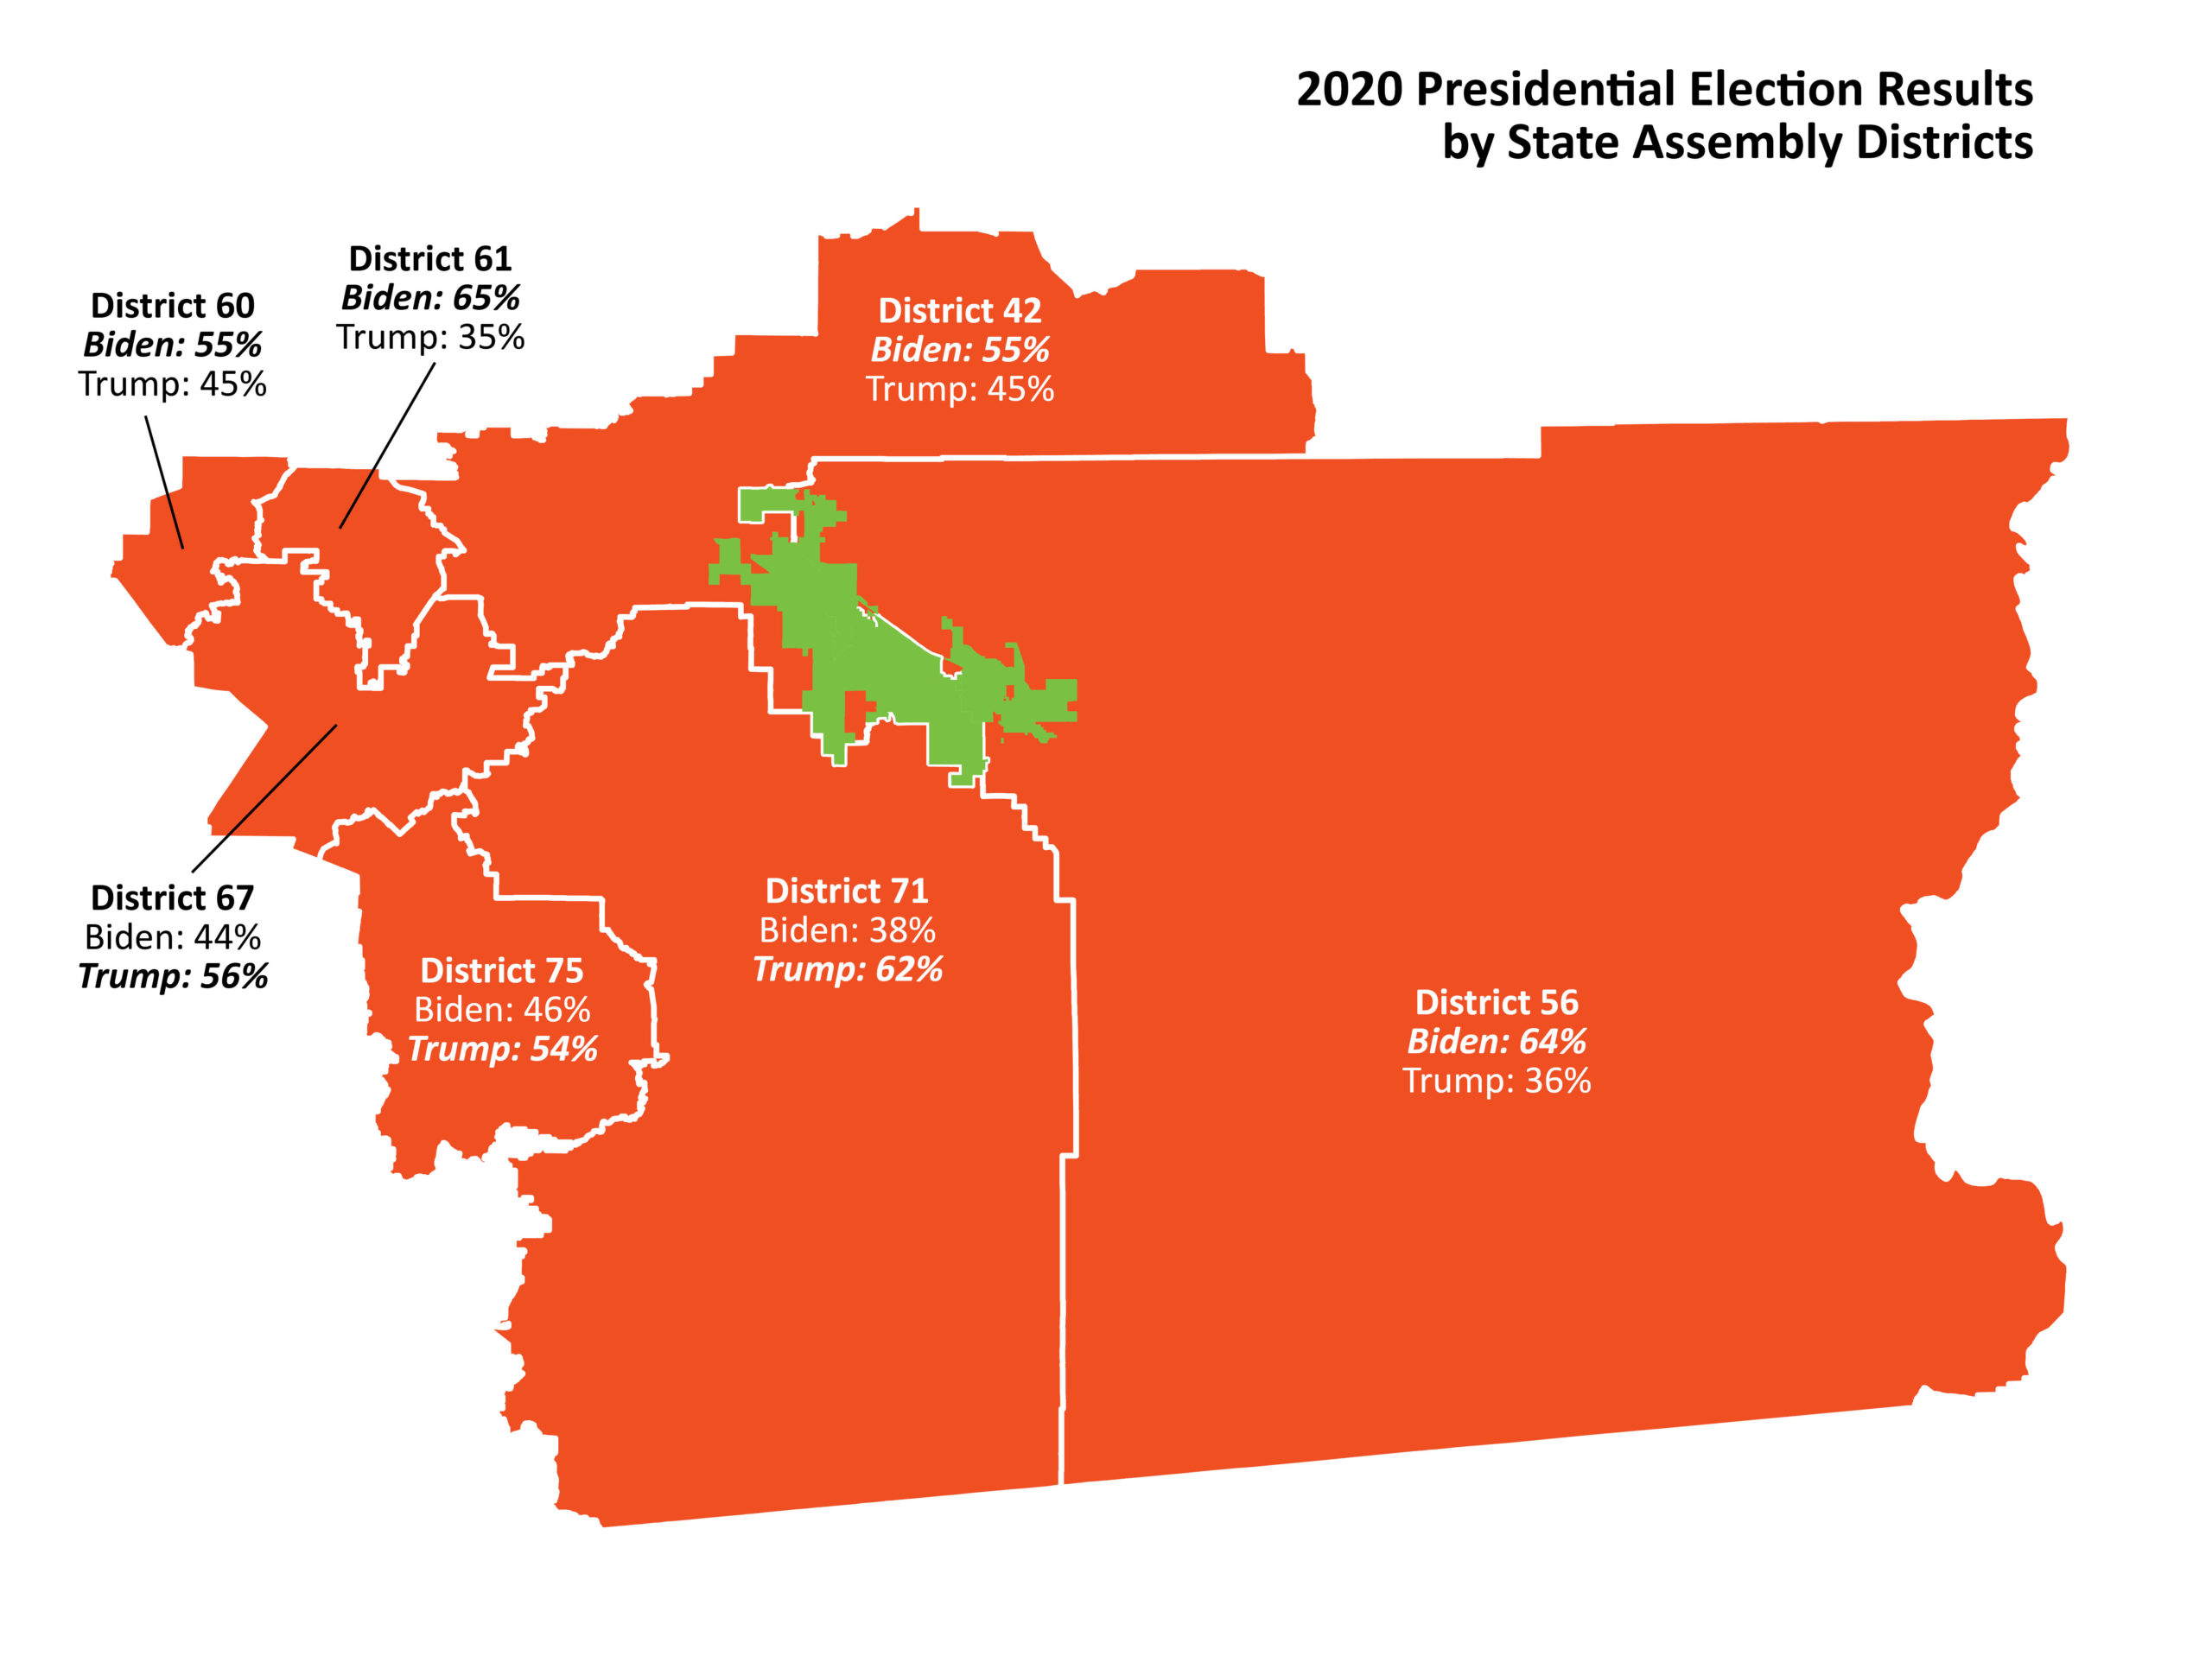
But when we look at our state assembly district boundary, instead of expanding to the west, it expands to the south, thus increasing Biden’s victory to 64%.
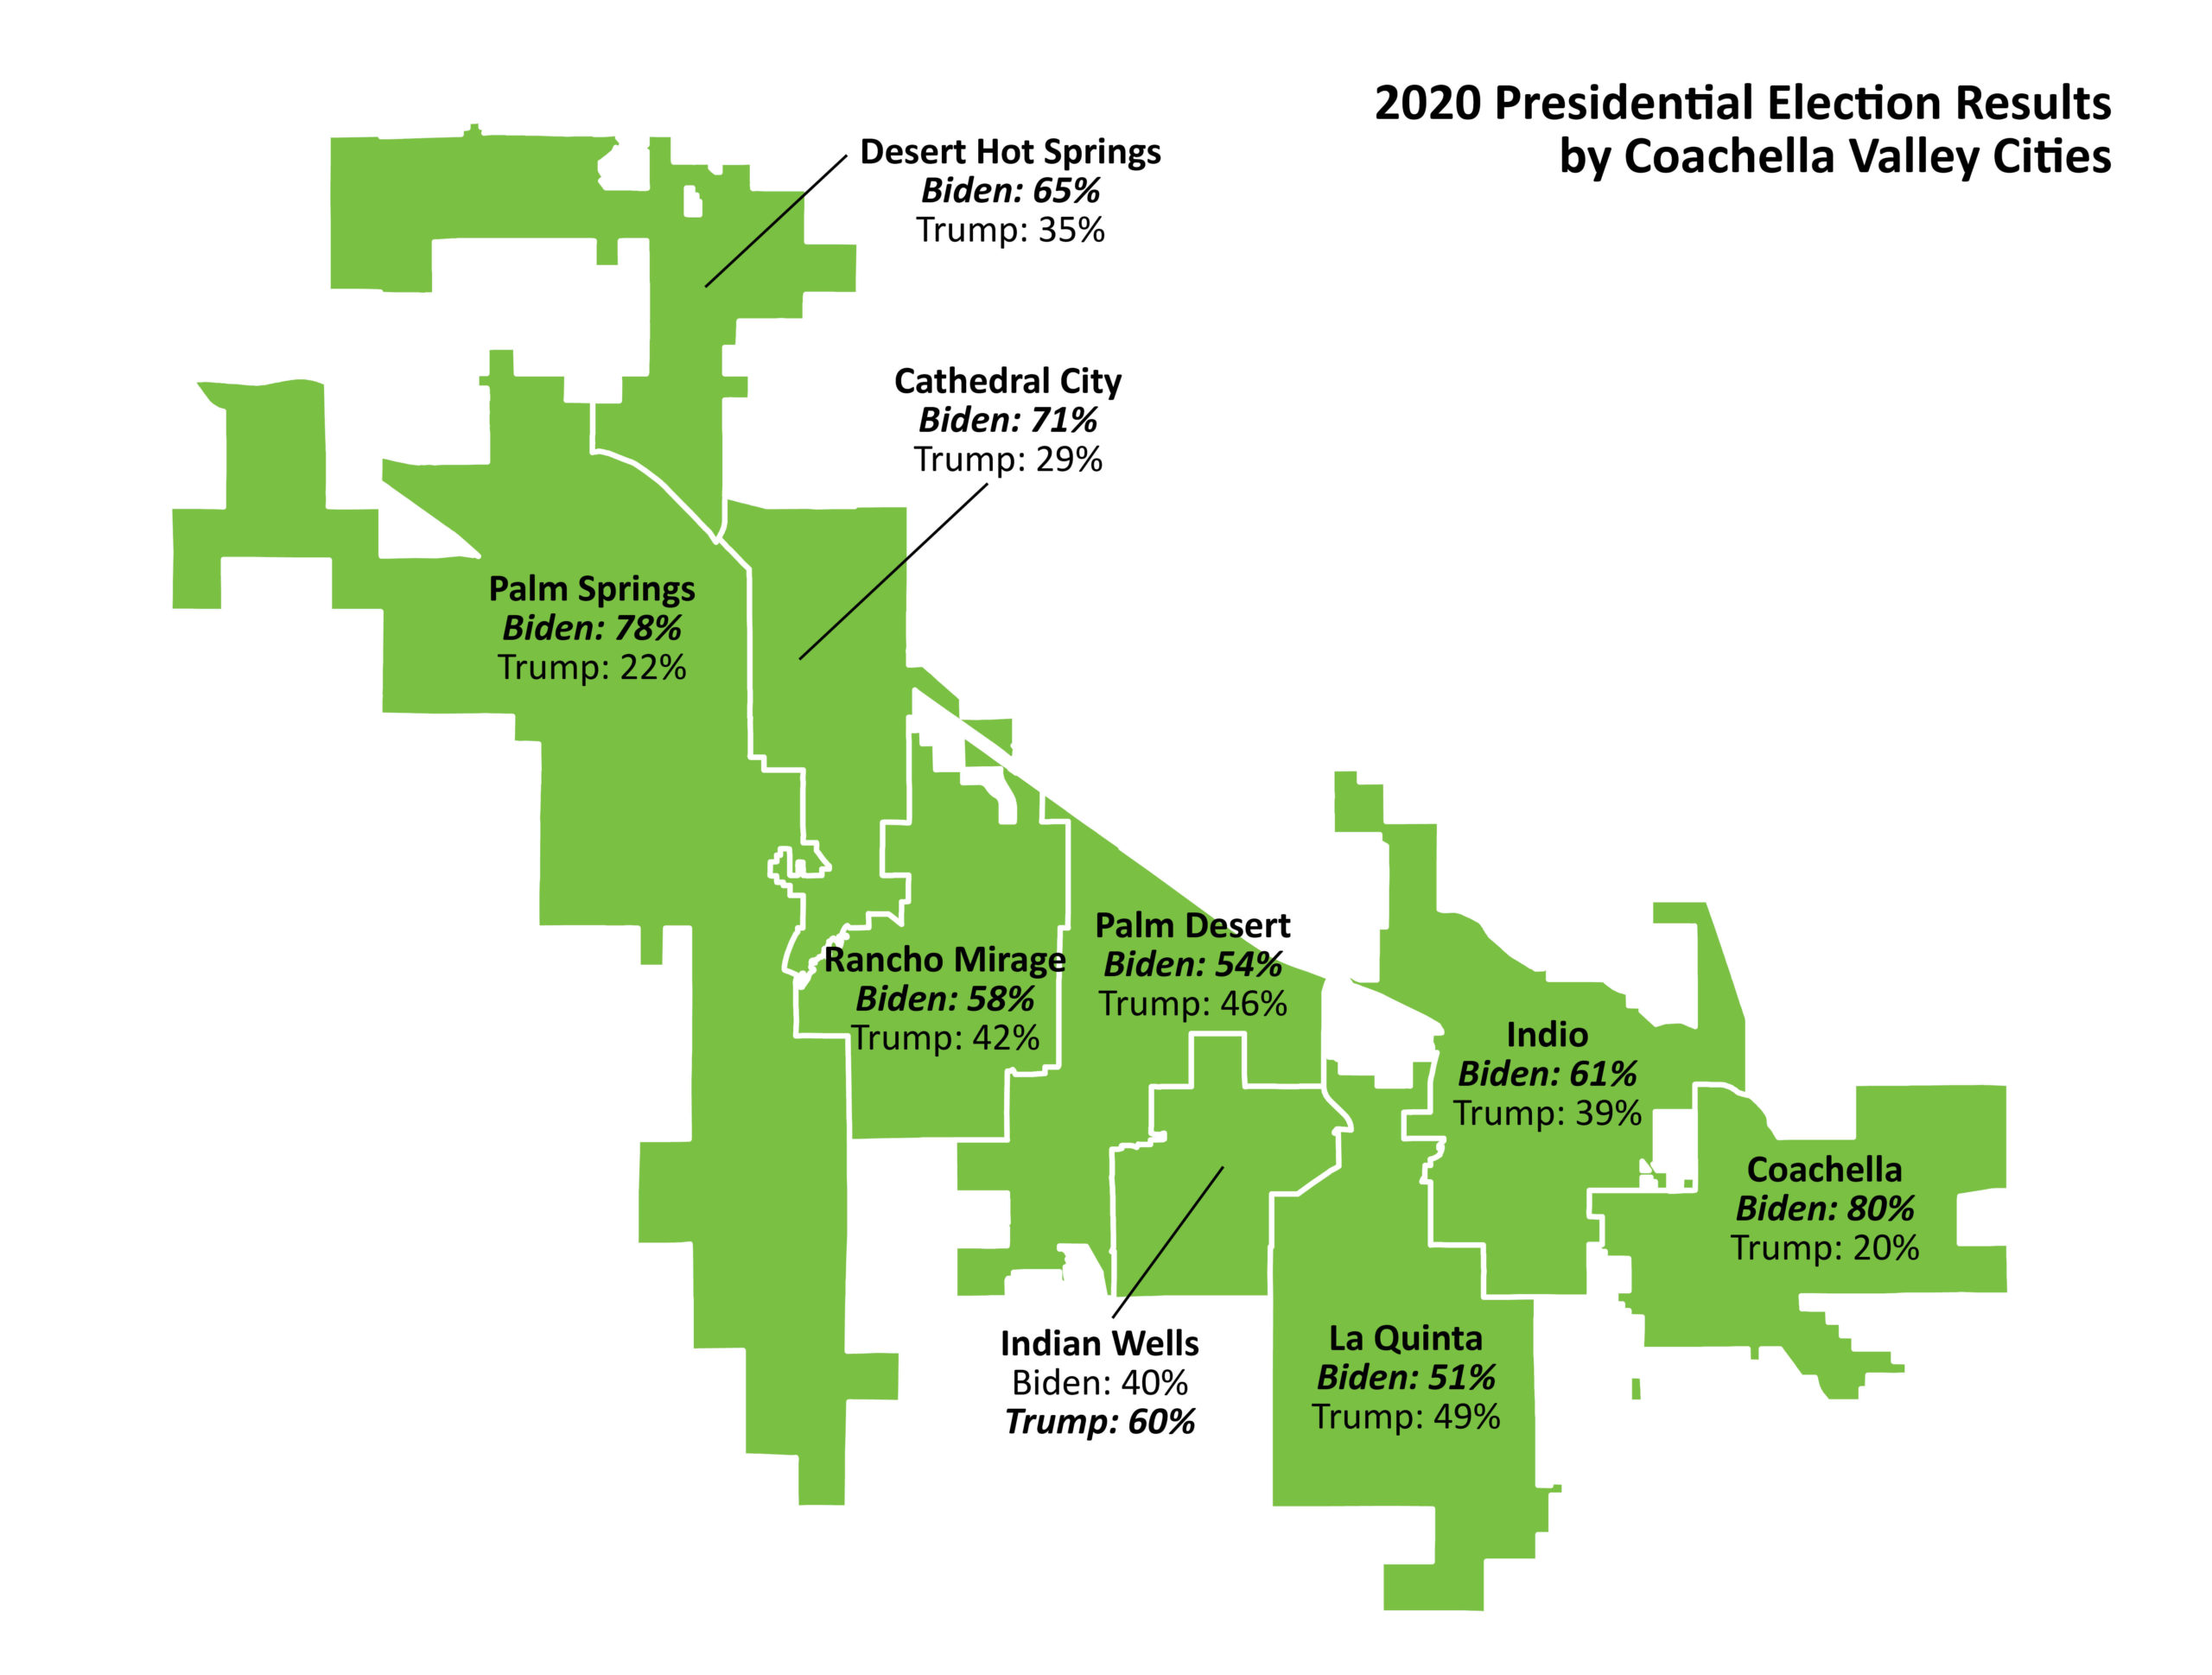
In the nine cities, Biden was the winner of the 2020 Presidential election in all but Indian Wells, where residents favored Trump at 60%. Coachella had the highest percentage of Biden voters, with 80%, followed closely by Palm Springs at 78%.


