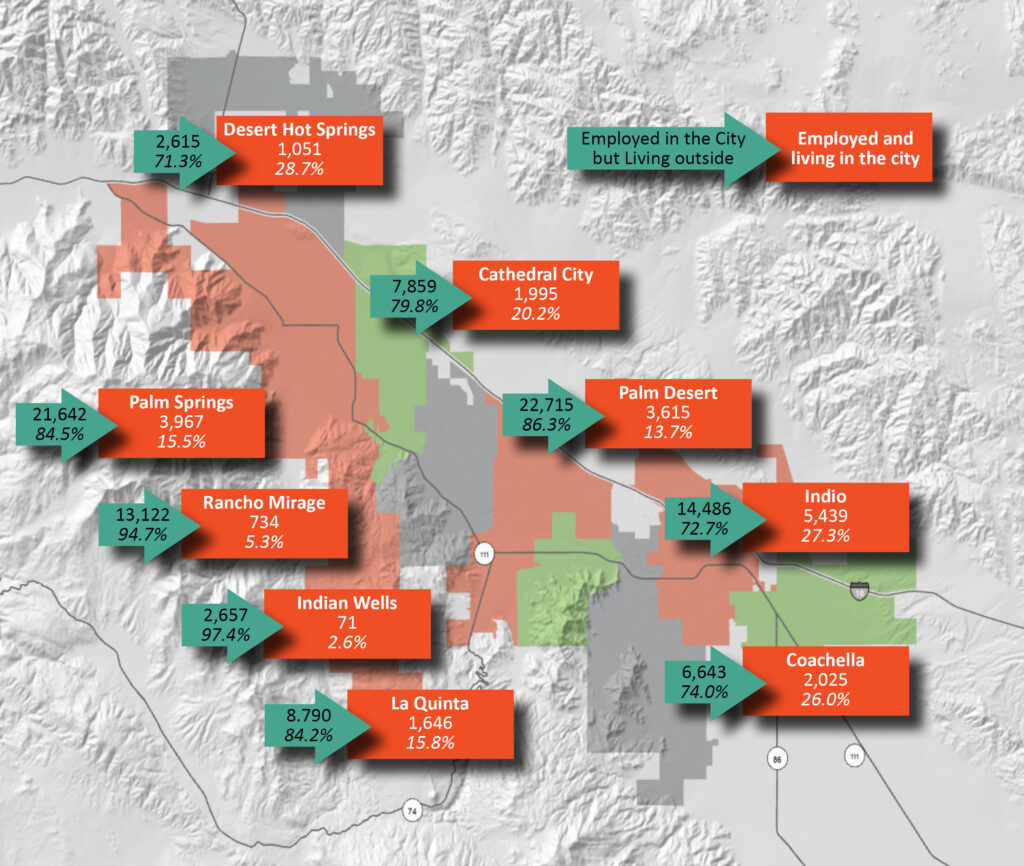
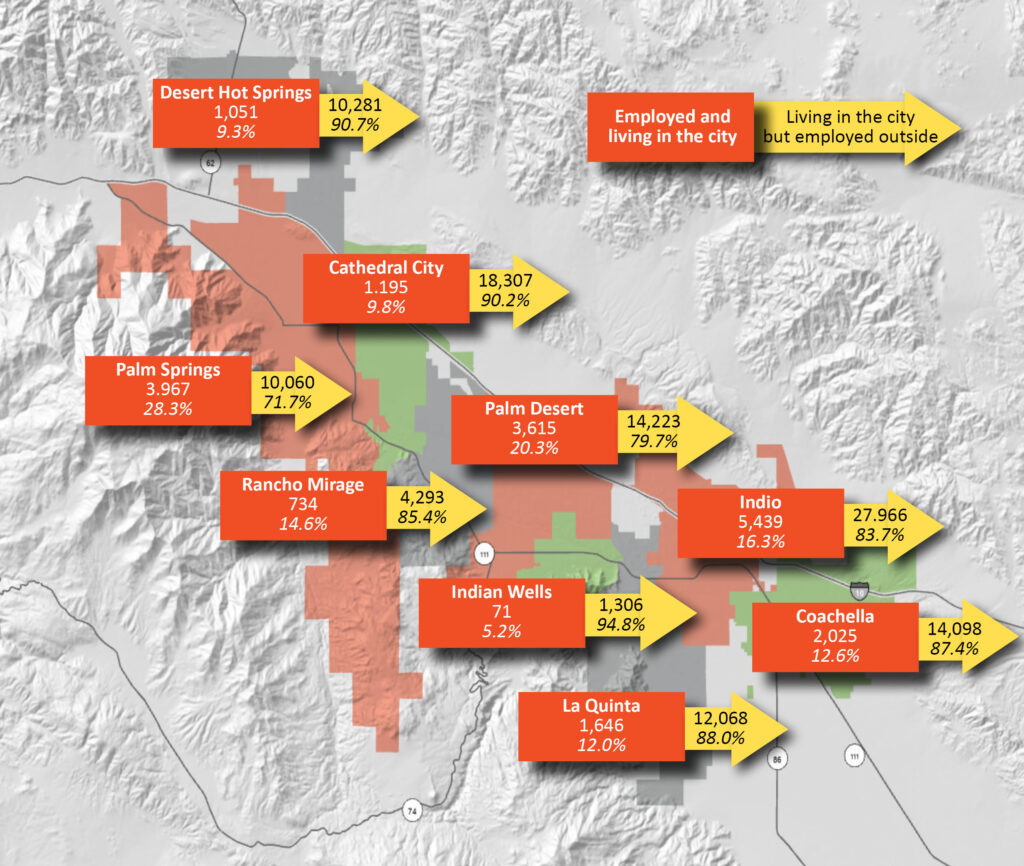
The Coachella Valley includes 9 incorporated cities within its informal border. This translates to nine different and ever-changing governing bodies, nine different cultures and vibes, nine different housing affordabilities and offerings – the list goes on. But are these independent entities truly independent? Are we in the habit of focusing too much on differences and perceived competition? Maybe we should spend more time on both our interdependencies and commonalities. That’s what CVEP concentrates on – regionalism and the hope of working together to make the Valley a better place to live and work for all. The following two maps from our upcoming Annual Greater Palm Springs Economic Summit report help to reinforce this narrative.
These two graphic maps show the inflow and outflow of employees working in business establishments in each city. The data comes from the American Community Survey and indicates the latest data available – 2022. Some live and work in their resident city, marked by orange rectangles. The top map shows arrows pointing towards the orange rectangles. This reflects how many workers are coming into the city to work. The bottom map shows yellow arrows pointing away from the orange rectangles. This indicates how many residents work elsewhere.


