

Every few years, the U.S. Bureau of Labor Statistics lists 20 occupations with the highest projected growth in employment for the next 10 years. The latest list ranks these predictions for 2023 to 2033. Today, we will examine how these high-growth occupations correlate to the Coachella Valley’s current workforce. A lot of graphs and data follow, but don’t be overwhelmed. Instead, explore these data for signs of possible opportunities in the next decade to strategically expand our workforce.
| 1 | Wind Turbine Service Technicians | 60% |
| 2 | Solar Photovoltaic Installers | 48% |
| 3 | Nurse Practitioners | 46% |
| 4 | Data Scientists | 36% |
| 5 | Information Security Analysts | 33% |
| 6 | Medical and Health Services Managers | 29% |
| 7 | Physician Assistants | 28% |
| 8 | Computer and Information Research Scientists | 26% |
| 9 | Physical Therapist Assistants | 25% |
| 10 | Operations Research Analysts | 23% |
| 11 | Actuaries | 22% |
| 12 | Occupational Therapy Assistants | 22% |
| 13 | Home Health Aides | 21% |
| 14 | Financial Examiners | 21% |
| 15 | Veterinary Assistants and Laboratory Animal Caretakers | 19% |
| 16 | Logisticians | 19% |
| 17 | Epidemiologists | 19% |
| 18 | Substance Abuse, Behavioral Disorder, and Mental Health Counselors | 19% |
| 19 | Veterinarians | 19% |
| 20 | Veterinary Technologists and Technicians | 19% |
These are the Bureau’s predictions for 2023 – 2033. The percentages represent predicted growth in that period. These occupations are from a variety of major occupation groupings:
- Management (1)
- Business and Financial Operations (2)
- Computer and Mathematical (5)
- Life, Physical, and Social Science (1)
- Community and Social Services (1)
- Healthcare Practitioners and Technical (4)
- Healthcare Support (4)
- Construction (1)
- Installation, Maintenance, and Repair (1)
![]() This table describes the Coachella Valley details of the top 20 fastest-growing jobs. As of Quarter 3, 2024, the Top 20 in the CV amounts to 5,028 jobs or 2.9% of the total workforce, with average annual wages of $70,325, well above the $52,971 of all jobs in the Valley. Estimated growth for all 20 occupations is expected to be higher than the national average. Location Quotients above 1 mean that these jobs have a higher concentration than the national average.
This table describes the Coachella Valley details of the top 20 fastest-growing jobs. As of Quarter 3, 2024, the Top 20 in the CV amounts to 5,028 jobs or 2.9% of the total workforce, with average annual wages of $70,325, well above the $52,971 of all jobs in the Valley. Estimated growth for all 20 occupations is expected to be higher than the national average. Location Quotients above 1 mean that these jobs have a higher concentration than the national average.
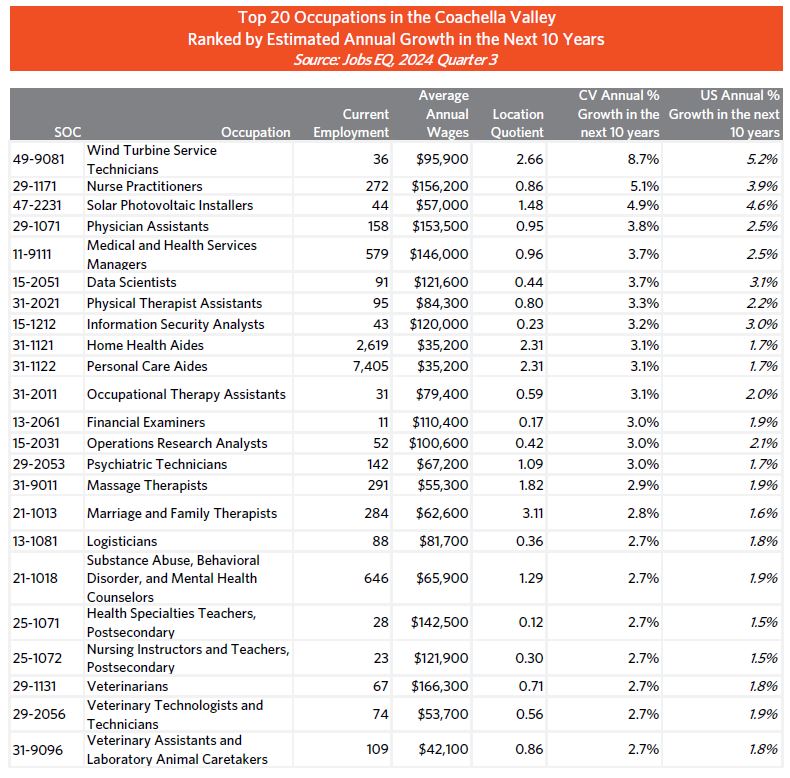
This table, by contrast, ranks the top 20 occupations expected to grow at the highest rate in the next ten years in the Valley, versus in the Nation. In every case, we expect to see higher growth here than in the nation. In this case, the CV top 20 account for 13,188 jobs, or nearly 8% of the total workforce. Unfortunately, the average wage falls to $38,342 due to the high employment in jobs like Home Health Aides and Personal Care Aides.
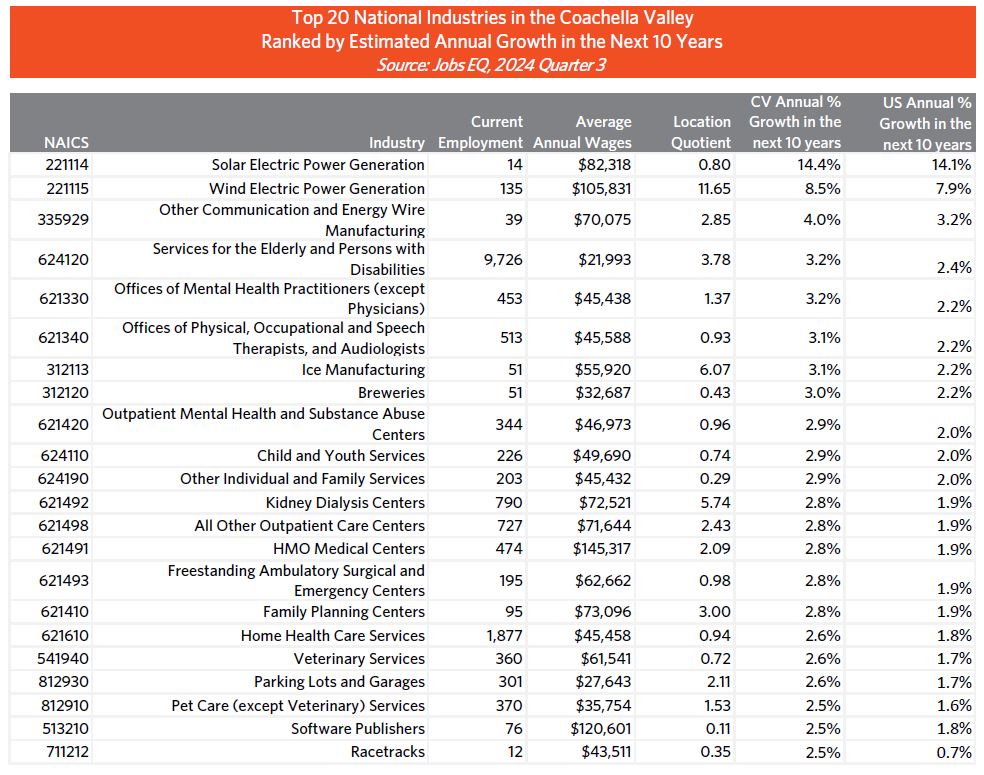
We can also rank estimated 10-year employment growth by ranking employment within industries. The North American Industry Classification System’s (NAICS) most specific level of industry data is the 6-digit “National Industry” listings (as opposed to the 2-digit “General Categories of 20 Economic Sectors”). This table ranks the top 20 industries with the highest predicted employment growth in the next 10 years. These specified industries provide 17,032 jobs in the Valley, or nearly 10% of all jobs. The average wage for this collection of industries is $38,358.
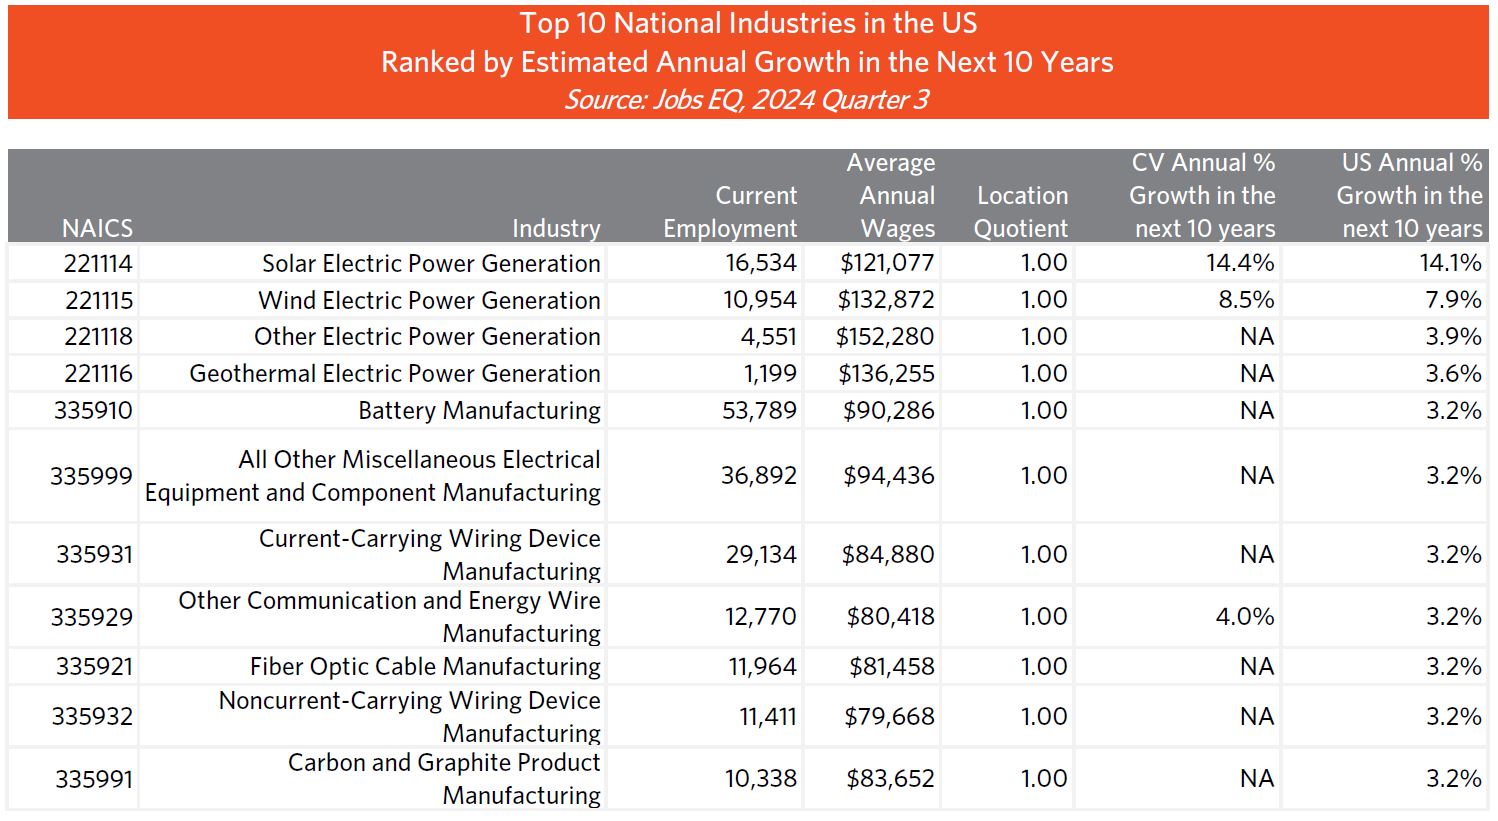
And finally, this table displays the top 10 national industries with the highest predicted national employment growth in the next 10 years. In this graph, current employment and wages represent National data, not data for the Coachella Valley.
All of these high-growth industries come from only two industry sectors – Utilities, and Manufacturing. Only three of these industries have employment in the Coachella Valley. Perhaps we should consider attracting some of these rapidly growing, high-paying industries to the Valley?


