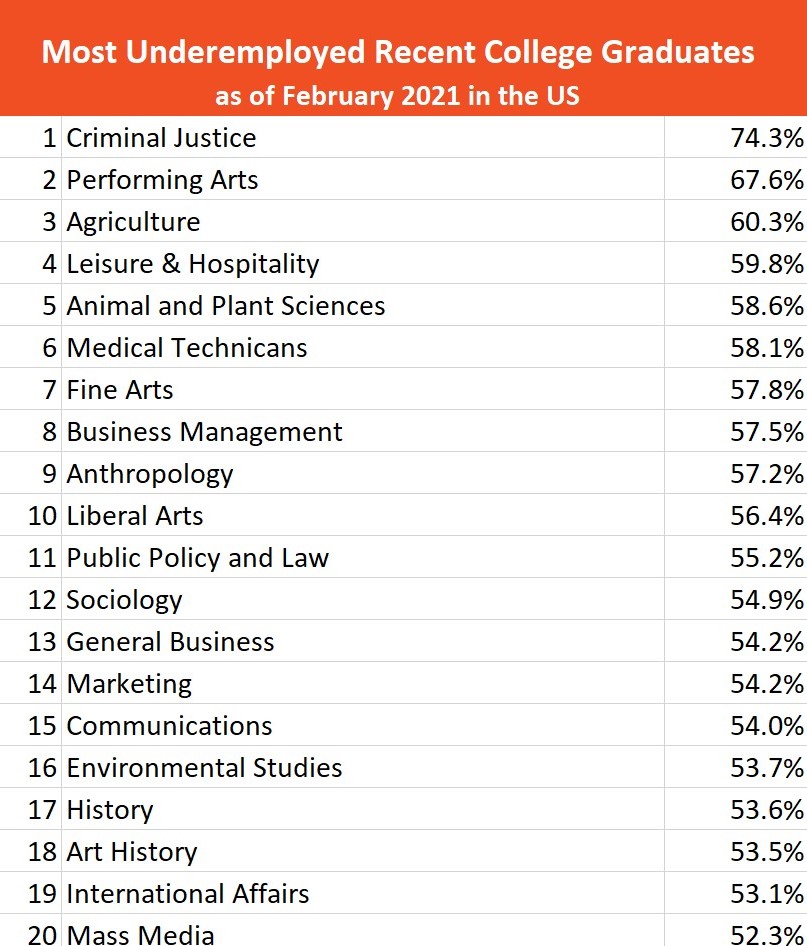
CVEP’s inimitable leader, Joe Wallace, frequently forwards the CVEP staff timely and persuasive articles about subjects pertaining to our regional economic development efforts. Recently, he sent a table displaying rankings of underemployment amongst recent college graduates. Note that these are not unemployed graduates, but underemployed graduates. If you are not making full use of your skills and abilities, or you are significantly under-compensated for such talents, you are underemployed.
This graph shows the most underemployed majors of these recent graduates. Of course, this list most likely reflects employment levels impacted by COVID. Of special note is the 59.8% rate for Leisure & Hospitality, the sector with the highest Coachella Valley employment.
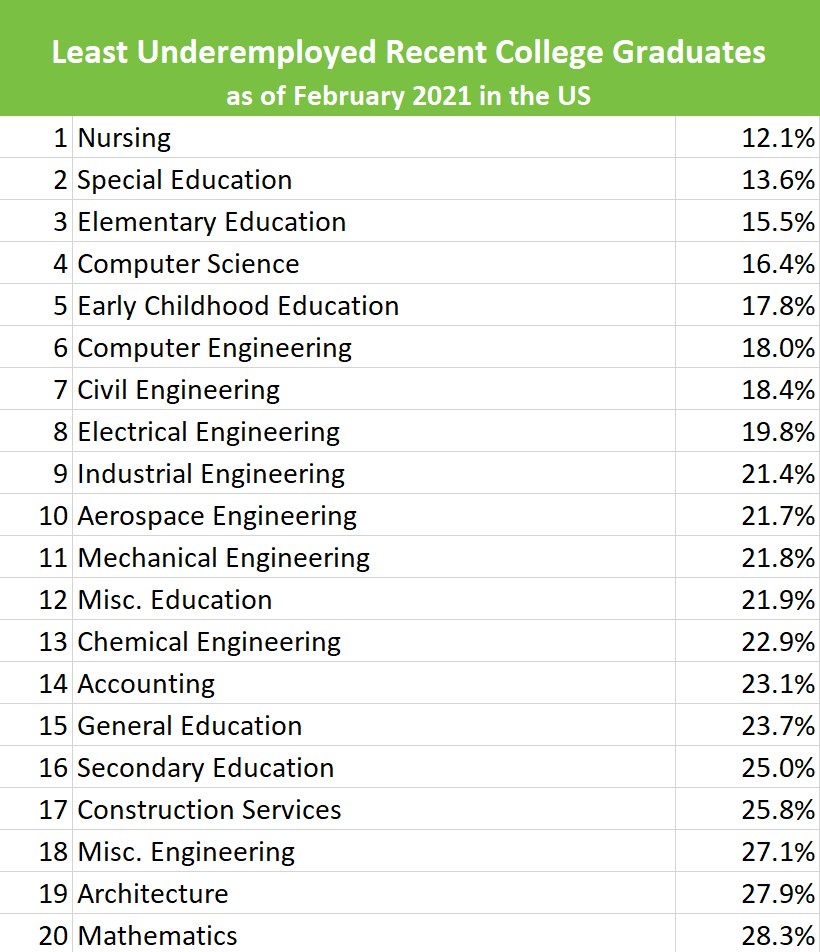
And here are the rankings for the least underemployed majors. Note the high prevalence of engineering and STEM majors in this ranking.
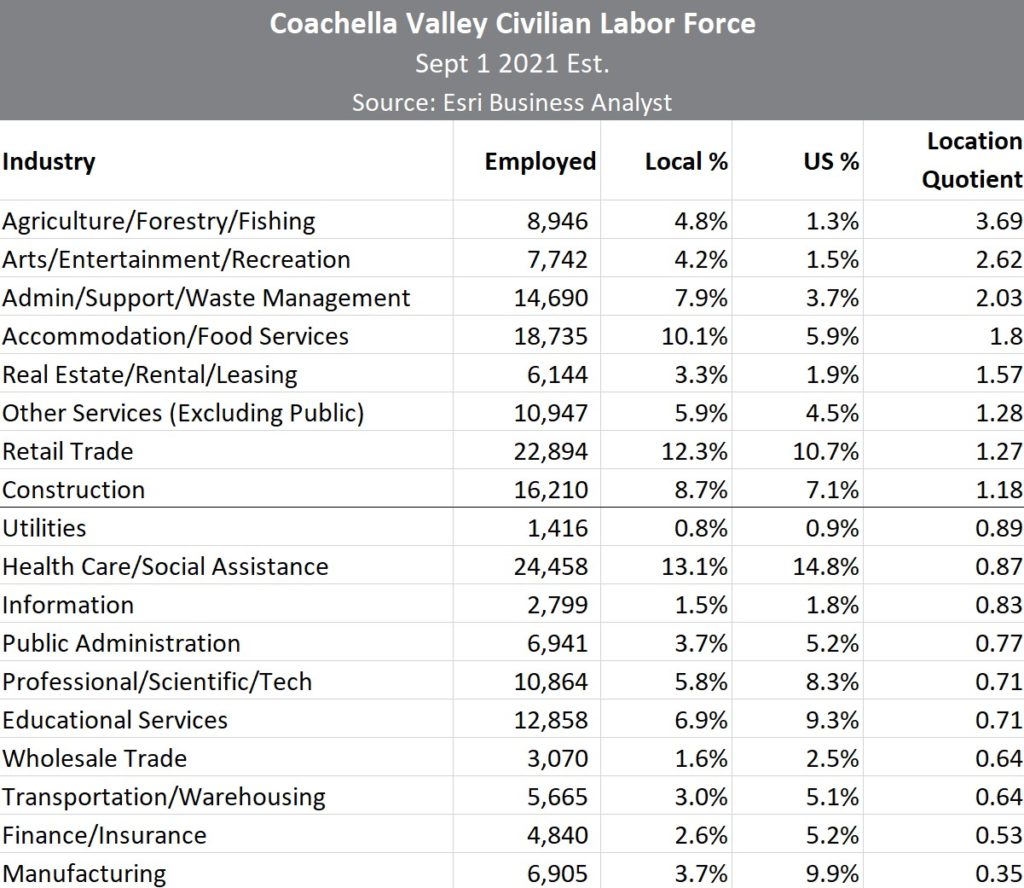
The next table displays Coachella Valley employment by major industry sectors. It includes an estimate of the total employment of the Coachella Valley civilian workforce as of Sept. 2021. It also compares the local share of that sector in the valley with the total national labor force share. Most importantly, the table ranks industry sectors by the location quotient.
Location quotients are ratios calculating an area’s distribution of employment by industry, ownership, and size class as compared to another reference area’s distribution. In this table, all industry employment in the U.S. is used as the reference area for the quotient. An LQ greater than 1 indicates an industry with a greater share of the local area employment than is the case nationwide. For example, the valley has an LQ greater than 1 (2.62) in the Arts/Entertainment/Recreation sector because this industry makes up a larger share of the valley employment total than it does for the nation.
A quick glance at the valley’s high location quotients is an excellent proxy for describing our local economy: agriculture, real estate, accommodation/food services, retail. Unfortunately, these are sectors composed of college majors with higher underemployment. The sectors of majors with low underemployment are greatly underrepresented in the valley.
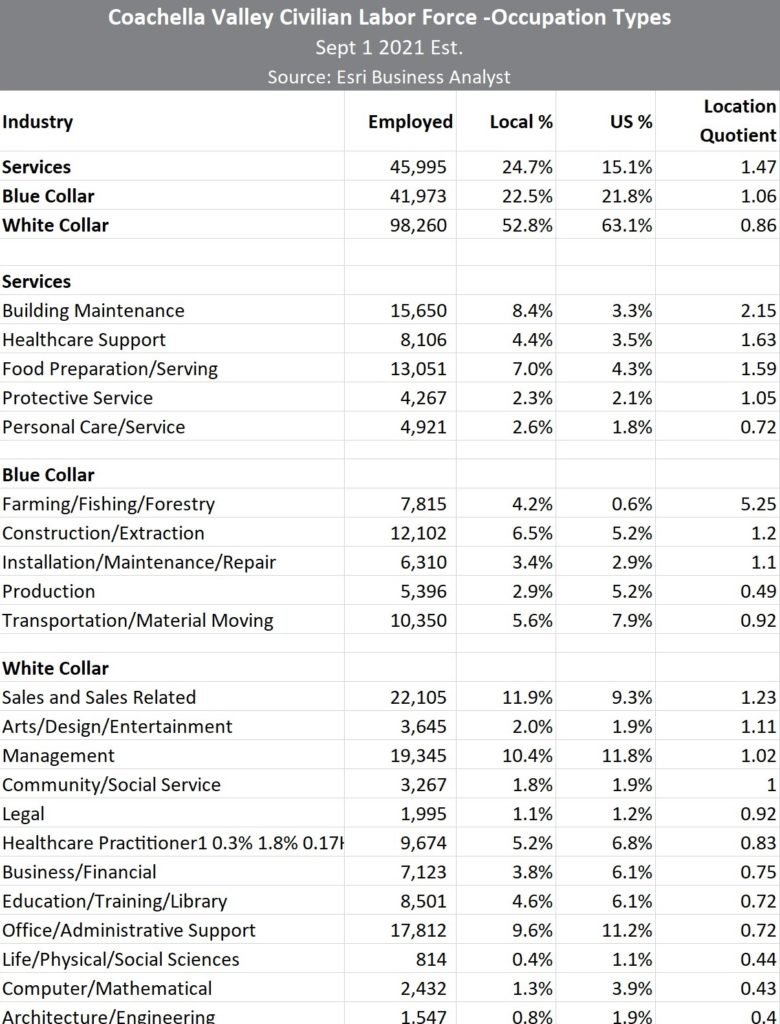
When you observe occupation types ranked by location quotient, as opposed to industry sectors, it reinforces the fact that the valley’s workforce is over-reliant underemployed occupations. As compared to the nation, our economy employs a much higher proportion of service occupations and is underrepresented in white-collar occupations. Well-compensated and lesser underemployed occupations like computer/mathematical and architecture/engineering have the lowest location quotients of all.


