

In my last blog, I endeavored to clarify the misunderstandings about race and ethnicity. Today we expand this exploration to look at diversity. The US Census Bureau authors a Diversity Index (DI). The DI is a measure of the probability that two people chosen at random will be from a different race or ethnicity group. Let us see how the diversity index maps onto the Coachella Valley.
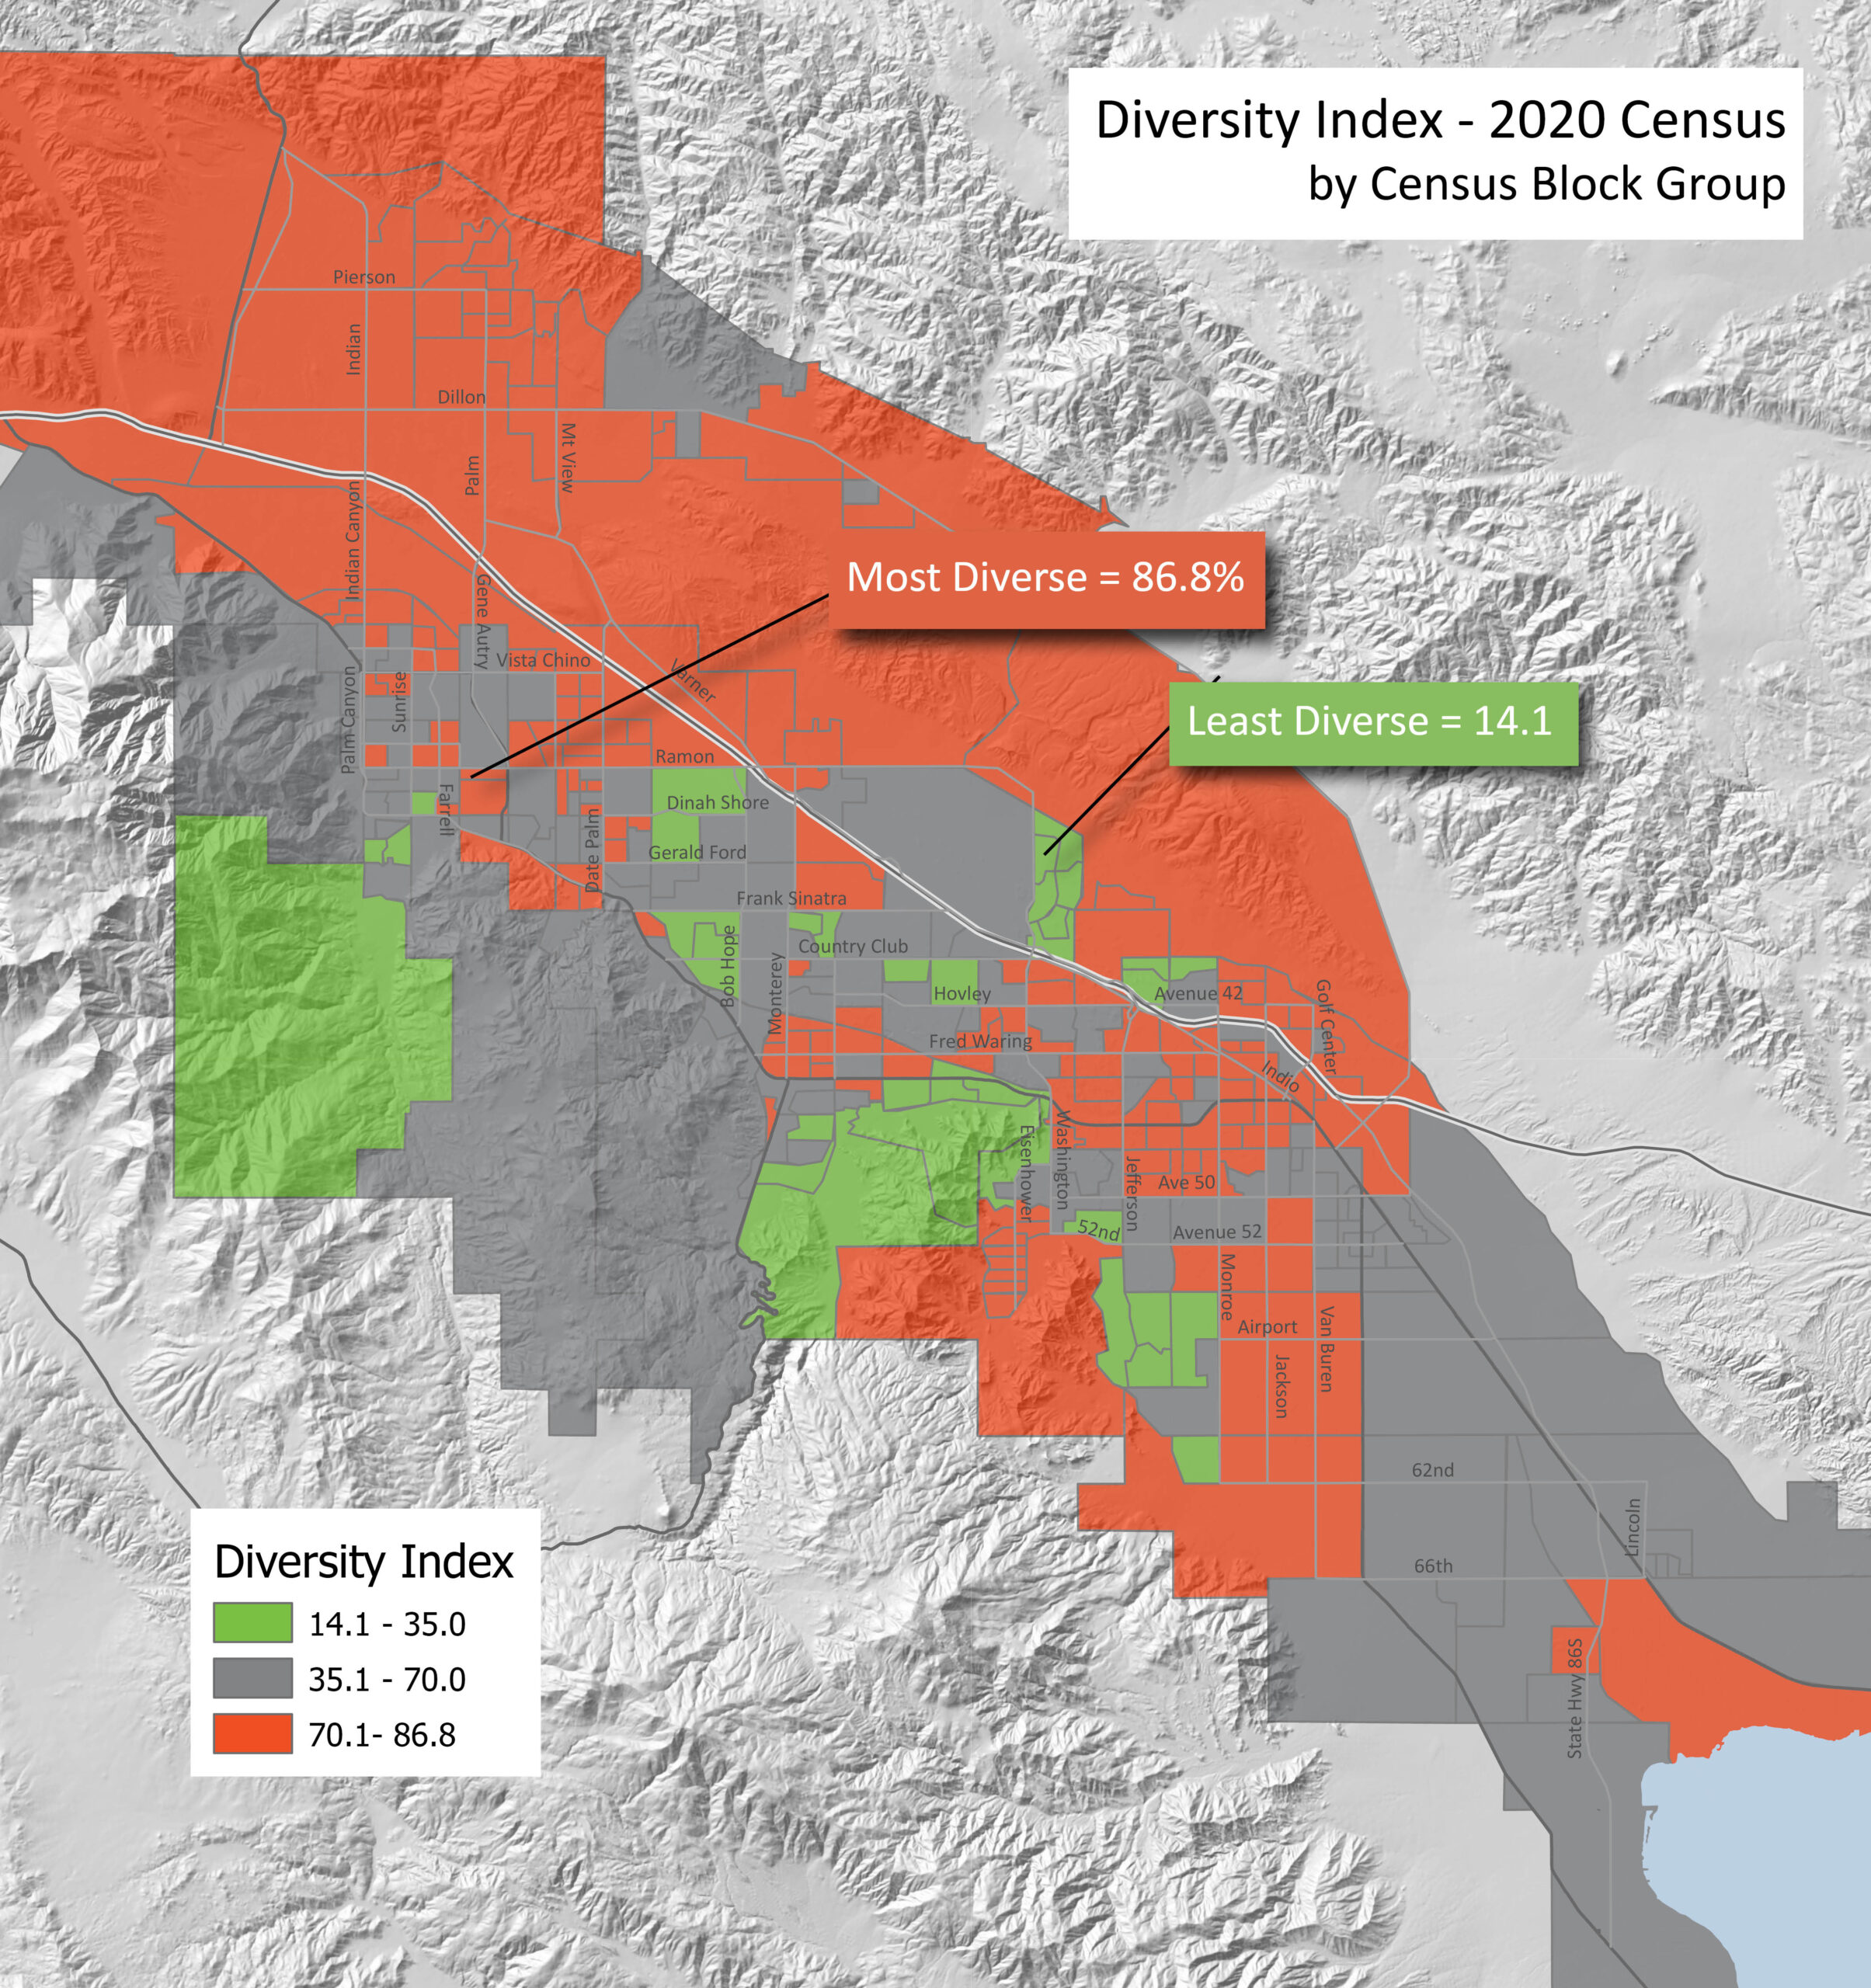
The Coachella Valley, with an overall DI of 63, is nearly identical to Riverside County. While we fall short of California’s overall diversity of 69.7 (only surpassed nationally by Hawaii – 76), we are more diverse than the US overall at 61.1. Looking at this map showing the DI by Census block groups, one notes that block groups of very high diversity are sprinkled throughout the valley. Some are even adjacent to neighboring block groups of comparatively low diversity.
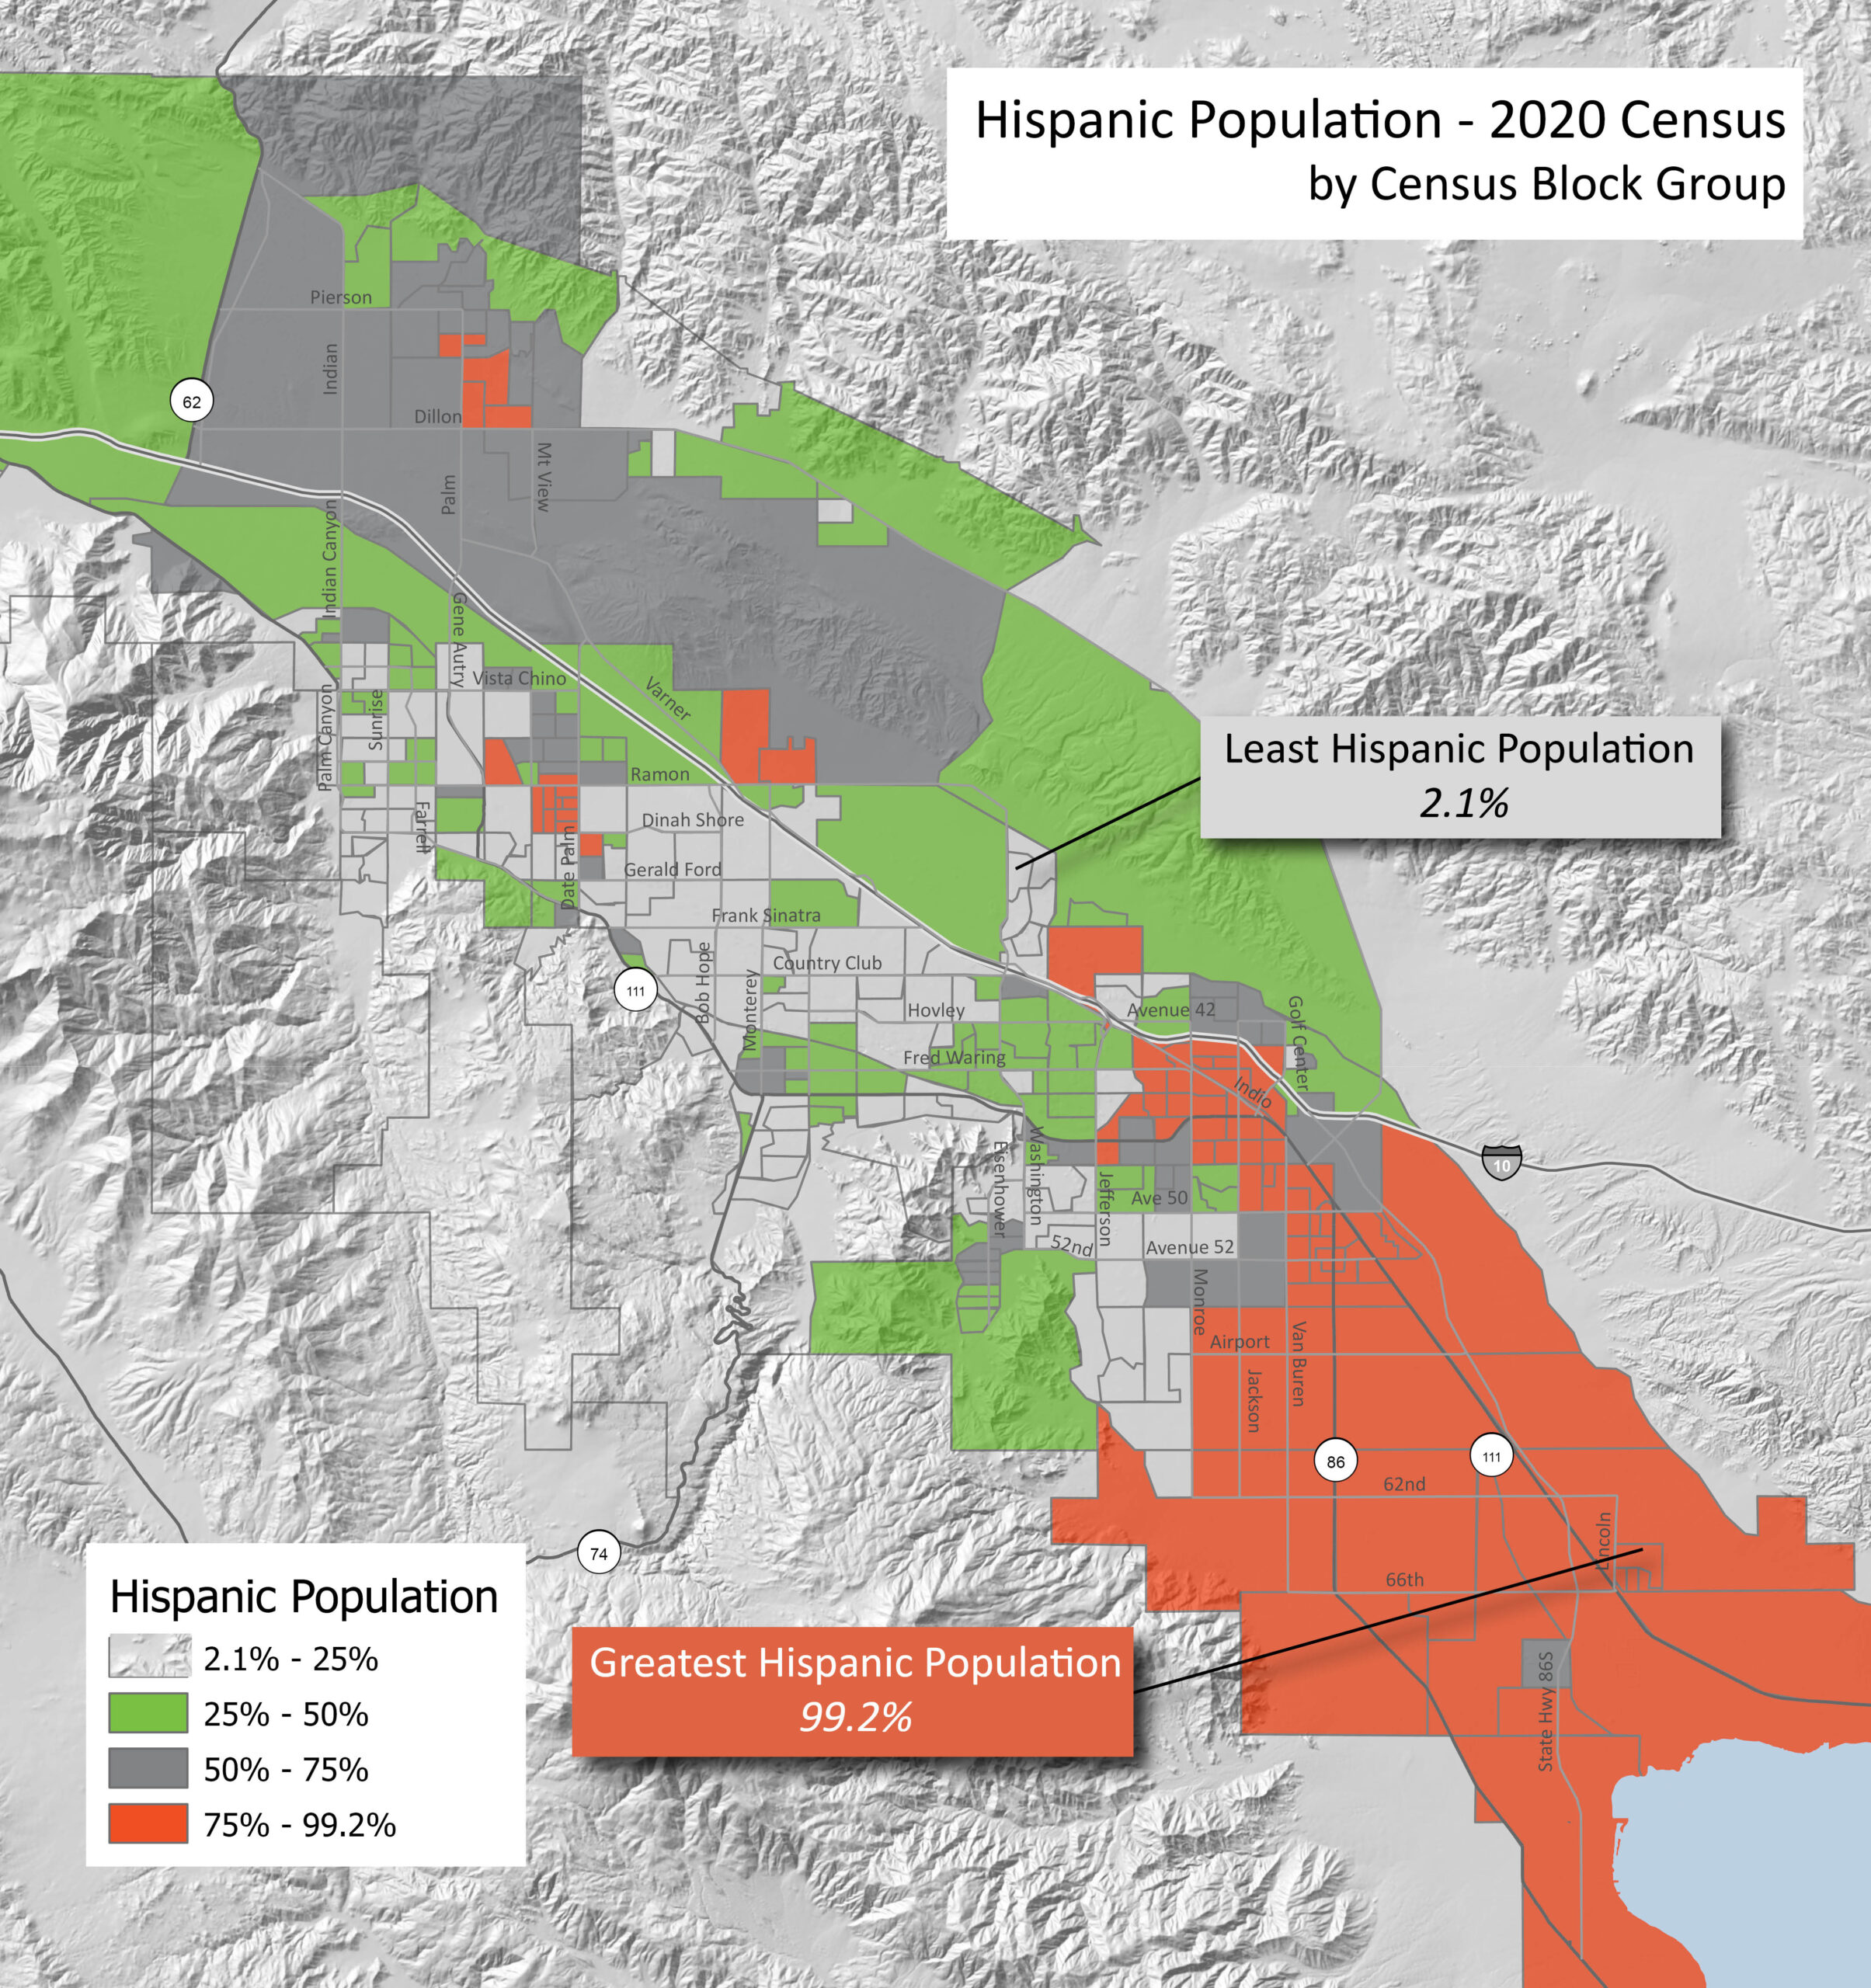
In the Coachella Valley, the largest racial or ethnic group besides White Only is the Hispanic population. This map shows the distribution of our Hispanic population, based on the 2020 Census, throughout the valley.


