Over the last few months, I have been honored to participate in planning the Desert Health Care District’s first Healthy Desert – Healthy You Summit. This first summit concentrates on Environmental Health. The summit is free. I would urge all to attend. A roster of amazing speakers will explore “empowering the community through resilient environments.”
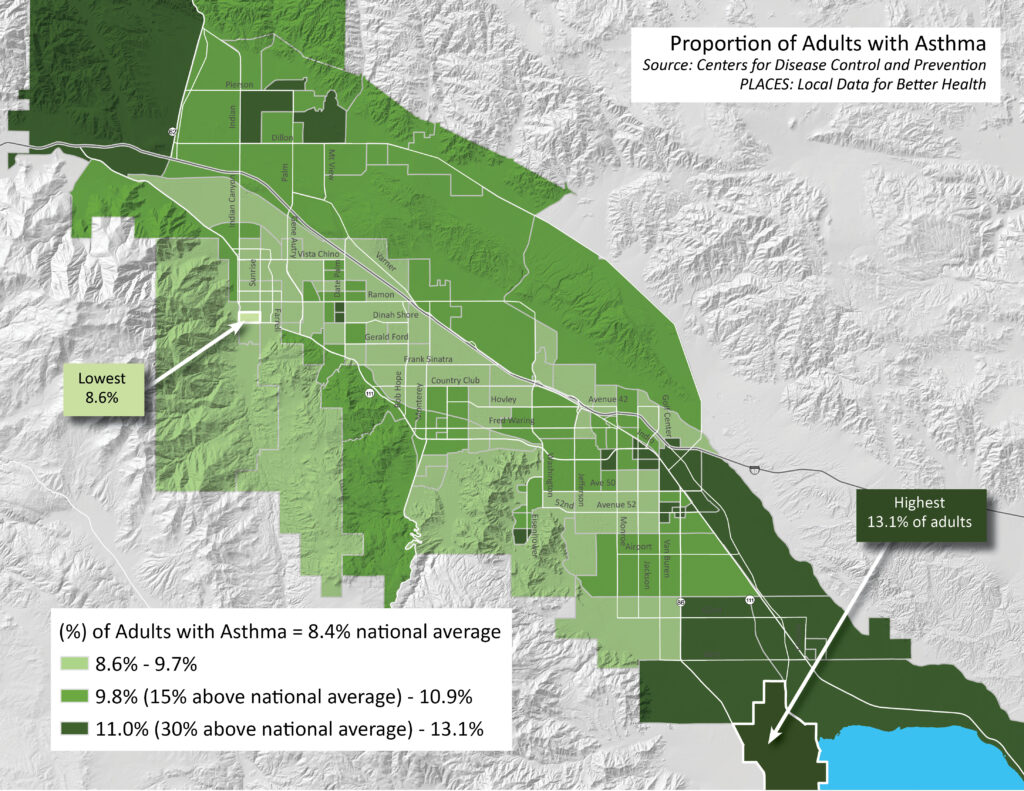
Mapping health equity and environmental challenges is vital to creating a healthy community. Mapping data about health issues abounds from many different sources. Today we will briefly examine two of those sources through the lens of asthma.
The prevalence of asthma in the U.S. has increased significantly over the past two decades, with adults below the poverty threshold and racial minorities experiencing disproportionately higher rates. Asthma is associated with a range of negative health outcomes, including depression, unemployment, and limited ability to work. Despite ongoing medical management, there is currently no cure for asthma. These findings highlight the urgent need for interventions to address asthma disparities.
Such disparities are particularly evident in the Coachella Valley. The first map displays data from the Centers for Disease Control. Their PLACES tool for Health Research examines many factors like health outcomes, prevention measures, risk behaviors, and social needs. This map shows the health outcome of asthma prevalence in adults. Areas in the darkest green have rates 30% or above the national average of 8.4%. Even the middle green tracts have rates at a minimum 15% higher than the national average. No Census Tract in the Coachella Valley has a proportion of adults with asthma lower than the national average.
In 2020, asthma prevalence was highest among adults below 100% of the poverty threshold (13.1%). It was highest among non-Hispanic multiracial adults (14.4%) followed by non-Hispanic Black persons (11.4%). Among states and territories, estimates of adult current asthma prevalence in 2020 ranged from 5.0% in Guam to 12.4% in West Virginia.
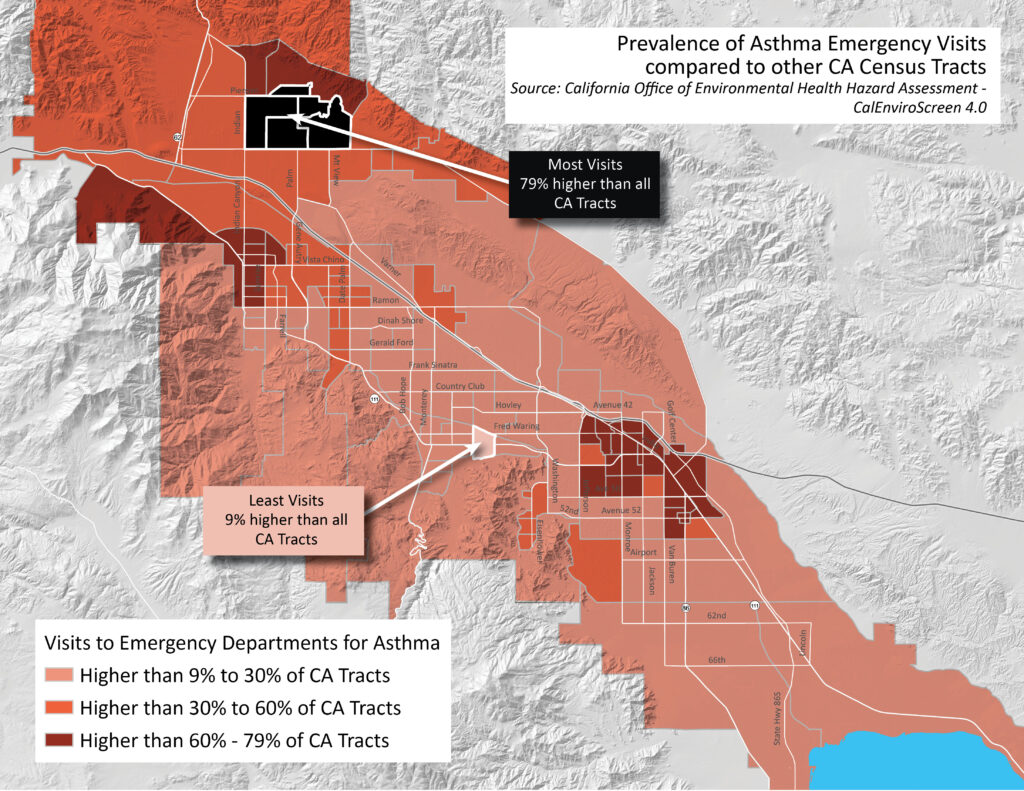
The data from this map comes from the California Office of Environmental Health Hazard Assessment (OEHHA). Specifically, they come from the CalEnvironScreen 4.0 initiative, a screening methodology to identify California communities disproportionately burdened by pollution. One such indicator is asthma rates. They identify the number of visits to emergency departments for asthma. You can see from the map that visits are concentrated in Indio and Desert Hot Springs with emergency visits 60% to nearly 80% higher than all other California tracts. One would expect to see more dark red surrounding the Salton Sea, a major contributor to local asthma rates. Since these data measure emergency visits, the proximity to hospitals and socioeconomic barriers to health care might reflect fewer such visits.
Desert winds, particulate matter, and dust from the Salton Sea all exacerbate asthma for our residents. Mapping helps to reveal high coincidences of these factors and measure them against known asthma rates. Limited resources can be pinpointed for populations with the most need. CVEP’s mission of diversifying the economy rests on improving the quality of life for all in the Coachella Valley.


