
In my last blog, we examined Congressional redistricting for the Coachella Valley. Because of disproportionate population growth in the Coachella Valley and the rest of Riverside County, our valley will now be split into two new congressional districts. Today we look at the underlying population trends that led to that split.
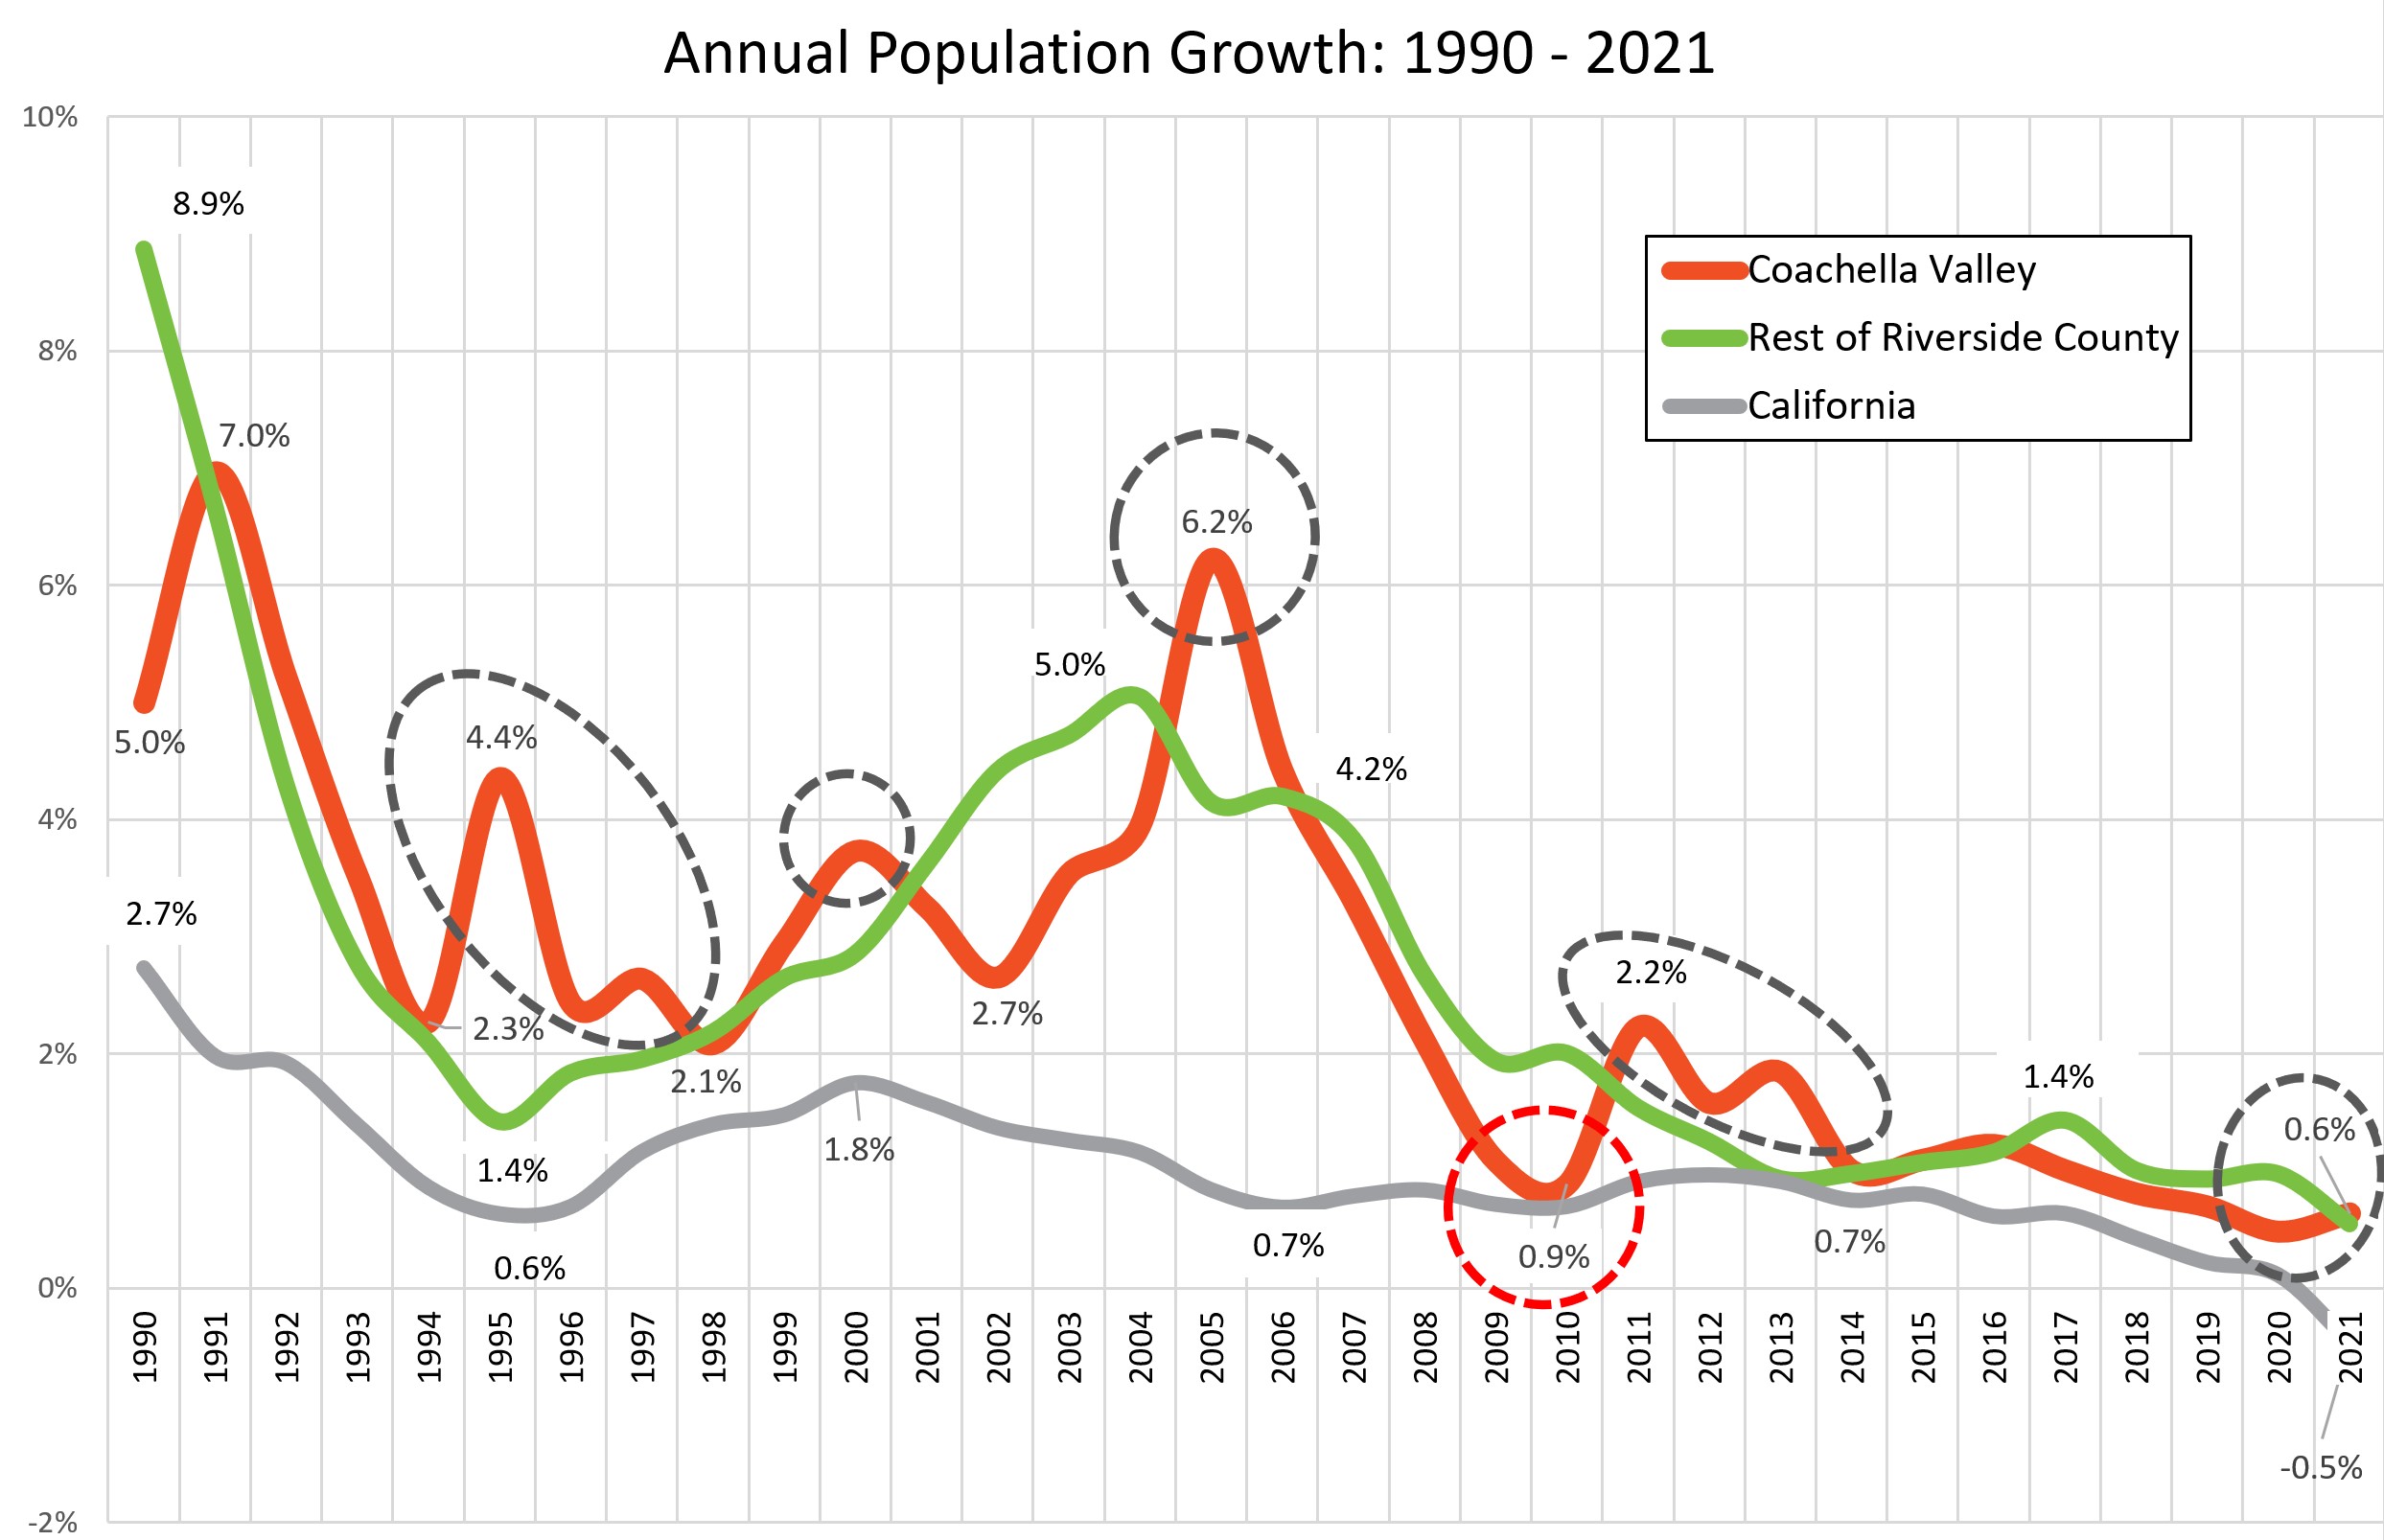
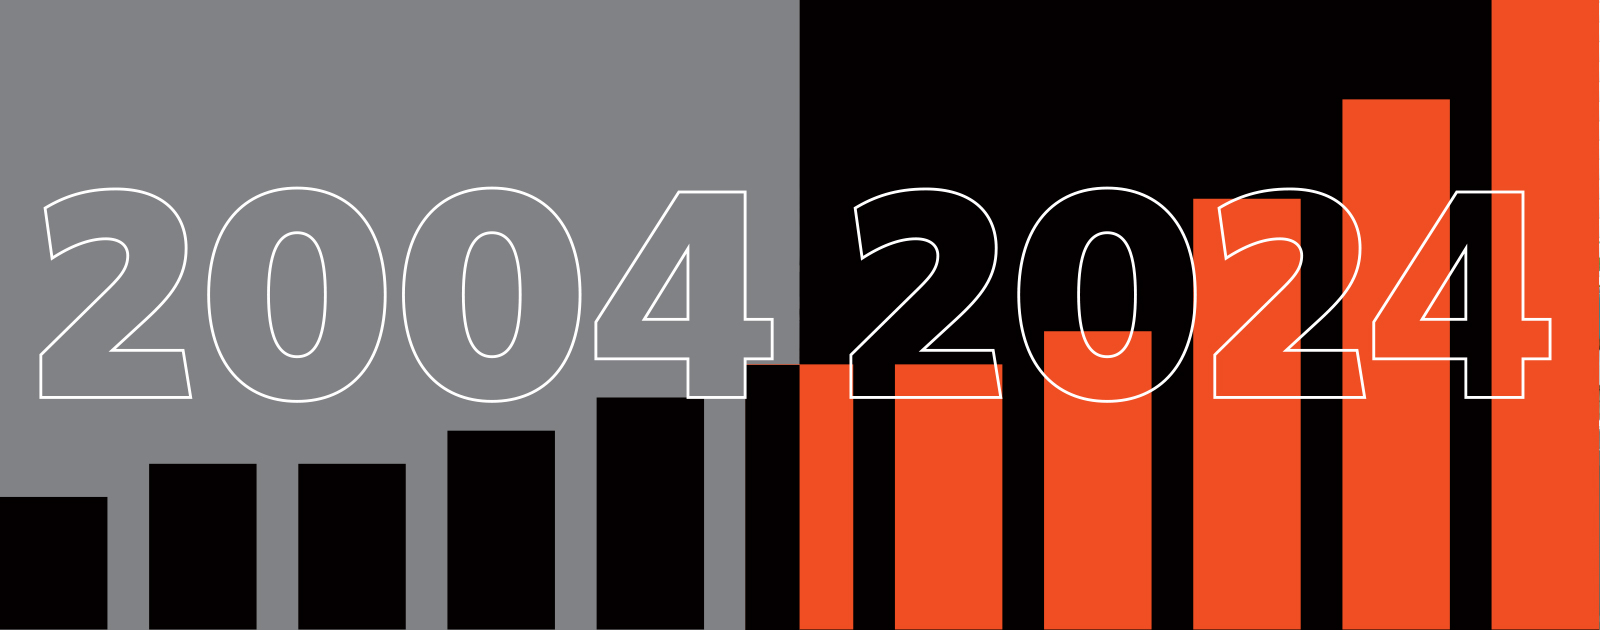
As displayed on the graph below, annual population growth in our valley and the rest of Riverside County vacillated greatly over the last thirty years. In contrast, the overall trend line in California was a slow but steady decline in growth. And between 2020 and 2021 California actually experienced a 0.5% decrease in population.
Contrastingly, the Coachella Valley and Riverside County saw greater population growth than the state during the last thirty years. One exception was the brief period between 2010 and 2013 during the slow recovery from the Great Depression. The Coachella Valley saw the highest comparable rates of growth from 1994 to 1997, 1999 to 2001, 2004 to 2007 (right before the real estate crash and the beginning of the Great Recession), and 2011 to 2014. Only in 2009 and 2010 did the valley’s growth drop to the low levels of California, another symptom of the real estate crisis.
As a result of the 2010 Census, the Coachella Valley congressional district pulled away from more populated Riverside County areas to concentrate on our valley and areas east. The significantly higher red and green lines on the graph reveal the need for this redistricting. And as growth higher than California continued from 2010 to 2020, Coachella Valley congressional districts were subsequently split in two.


