

We had so much fun creating interactive content for the last Data Digest that we decided to do it again. Today we present an interactive map showing broadband internet availability in the Coachella Valley. CVEP has long championed high-speed internet availability as a crucial component of attracting and retaining businesses in the valley. Remote-work households considering relocating to our valley look for high-speed internet when contemplating a move. While broadband access has improved, we have a long way to go. Click here to explore the map.
Our interactive map utilizes layers produced by Esri that compute a broadband score based on Federal Communications Commission (FCC) Form 477 data. The FCC requires “all facilities-based broadband providers to file data with the FCC twice a year (Form 477) on where they offer Internet access service at speeds exceeding 200 kbps (0.20 megabits per second) in at least one direction. Fixed providers file lists of census blocks in which they can or do offer service to at least one location.” You can zoom into this map to get this census block level data.
The FCC’s minimum standard for broadband of 25 Mbps download and 3 Mbps upload sets the broadband score at 100. That score is then weighted by the population in the area, the population served by different speeds, and breakdowns of race/ethnicity. The map layers have been color-coded to show speeds above and below this FCC standard of 100. Red/orange areas are below the standard, and green areas are above. These data are updated twice yearly, but the FCC takes a while to compile them. The most recent data in these maps is for June 2021.
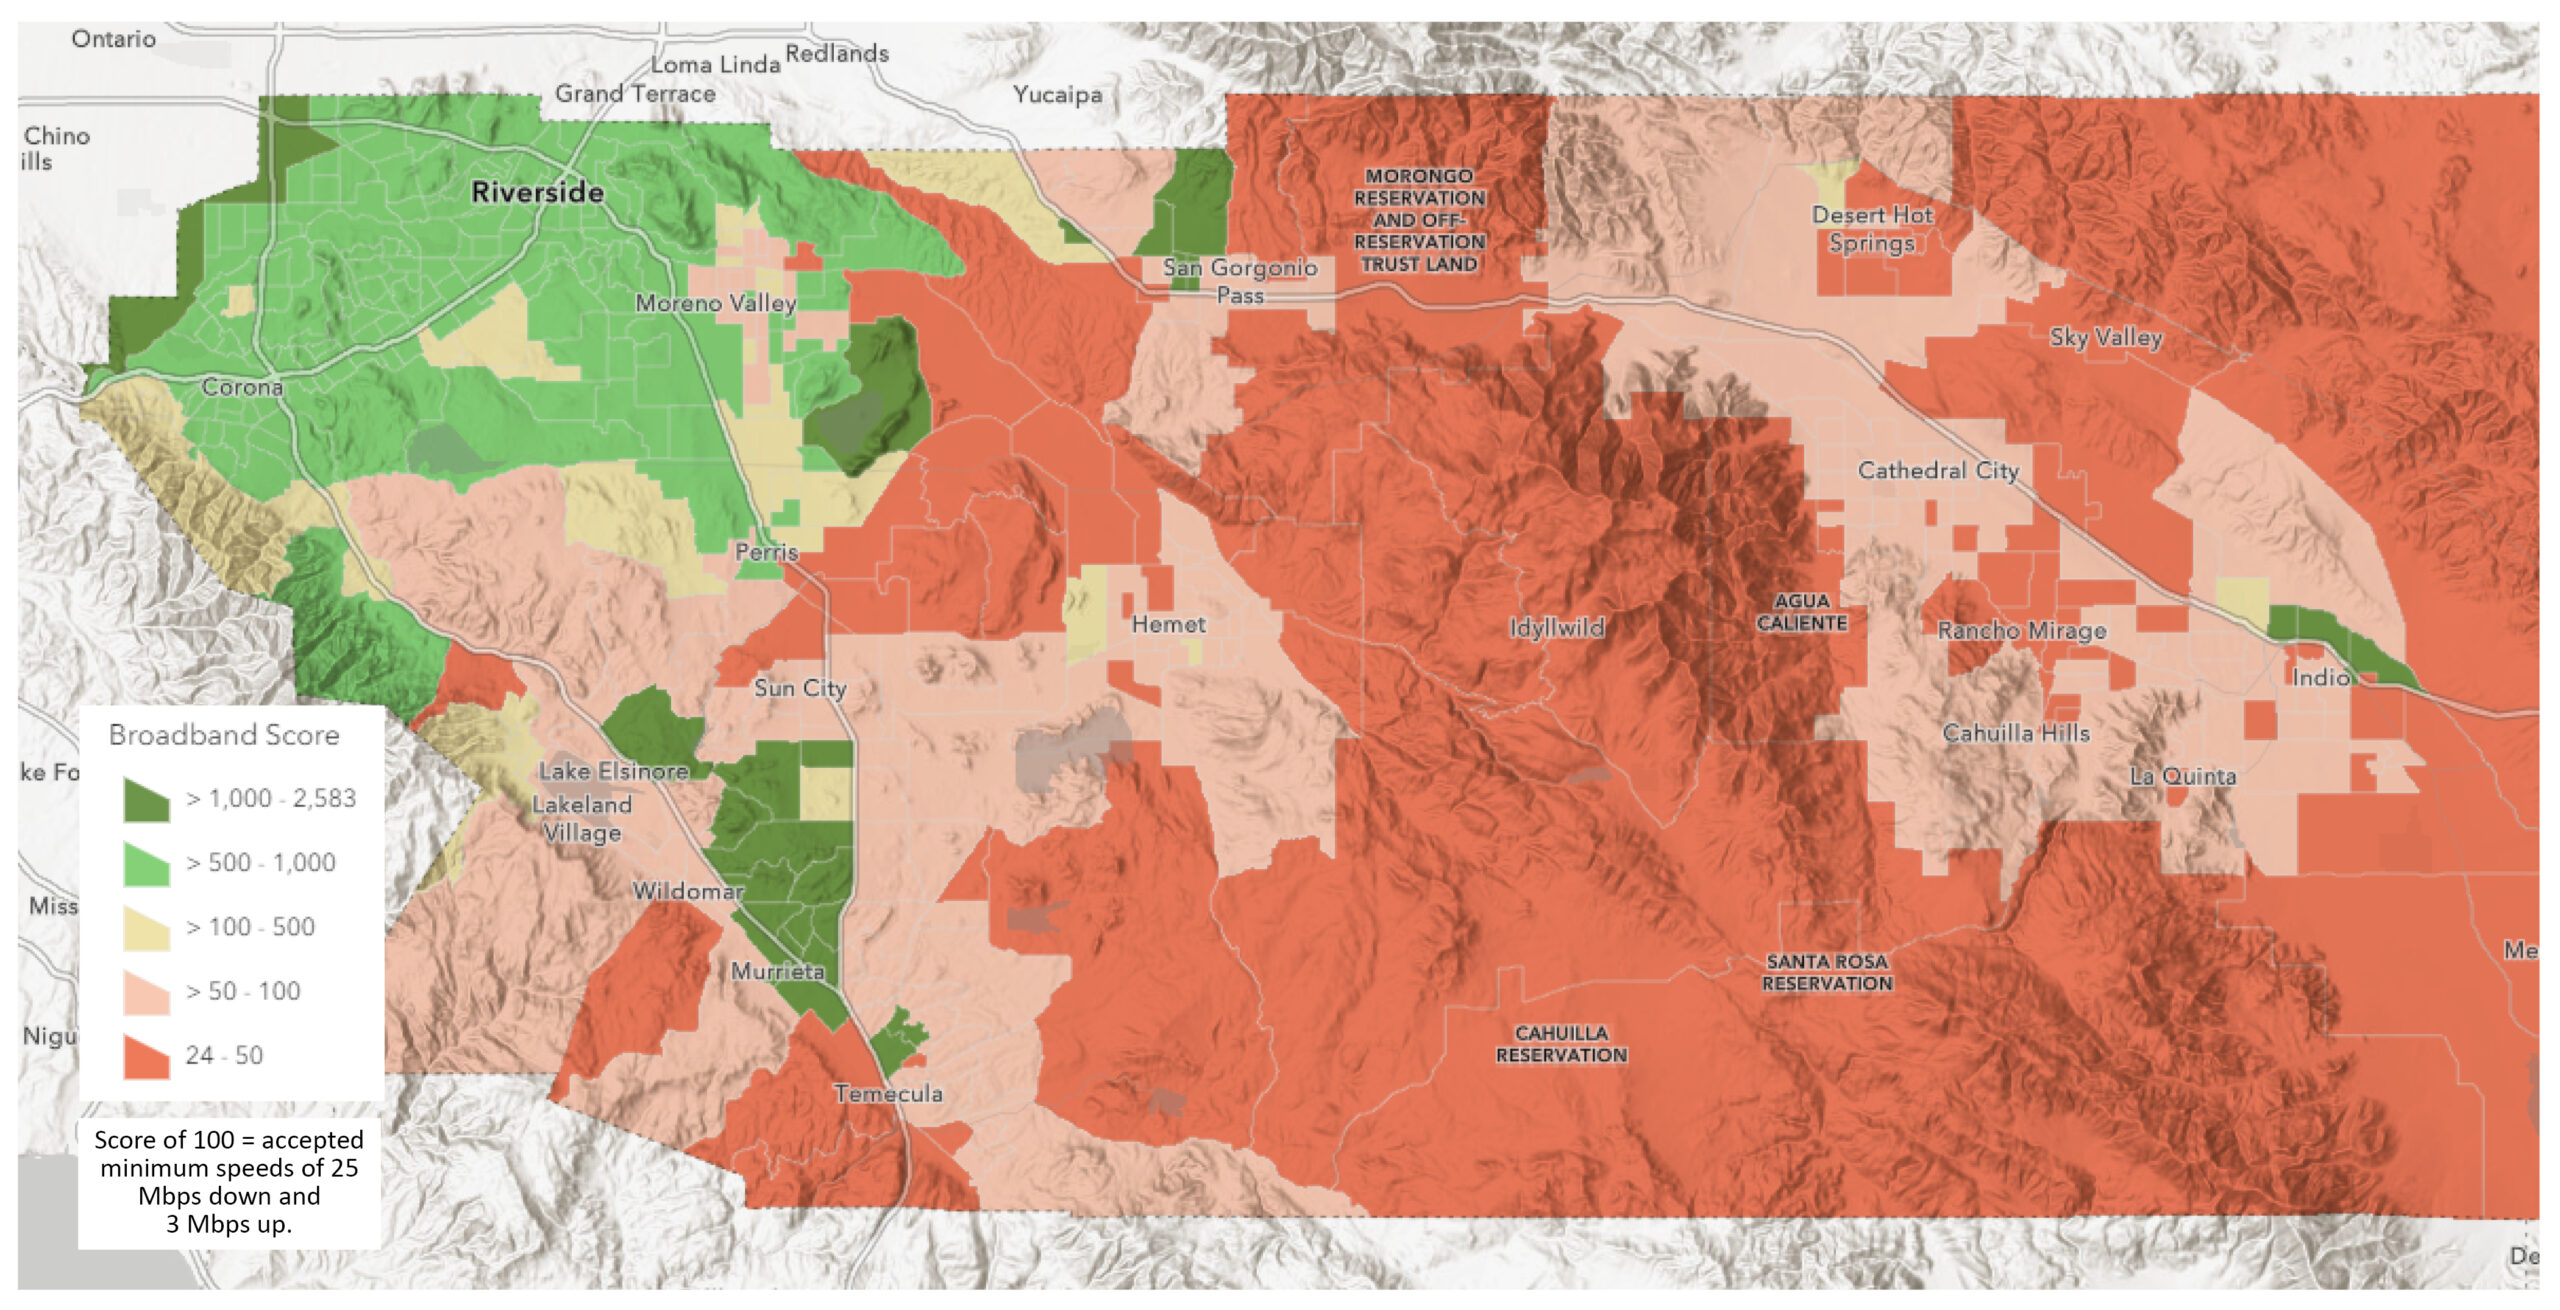
Because the score is calculated in real-time based on the user’s selection, we have filtered the data just for Riverside County, for performance issues. This map shows Western Riverside County east to the Coachella Valley. At this scale, we are seeing Census tract data. Note how Western Riverside County has much more contiguous high-speed access in the aggregate, while the Coachella Valley has much less. Be aware that at the Census tract level, the broadband scores are computed for a much larger area. If we zoom in, the scores become more nuanced. Still, at this scale, only five census tracts in the Coachella Valley have aggregated broadband scores above the FCC standard.
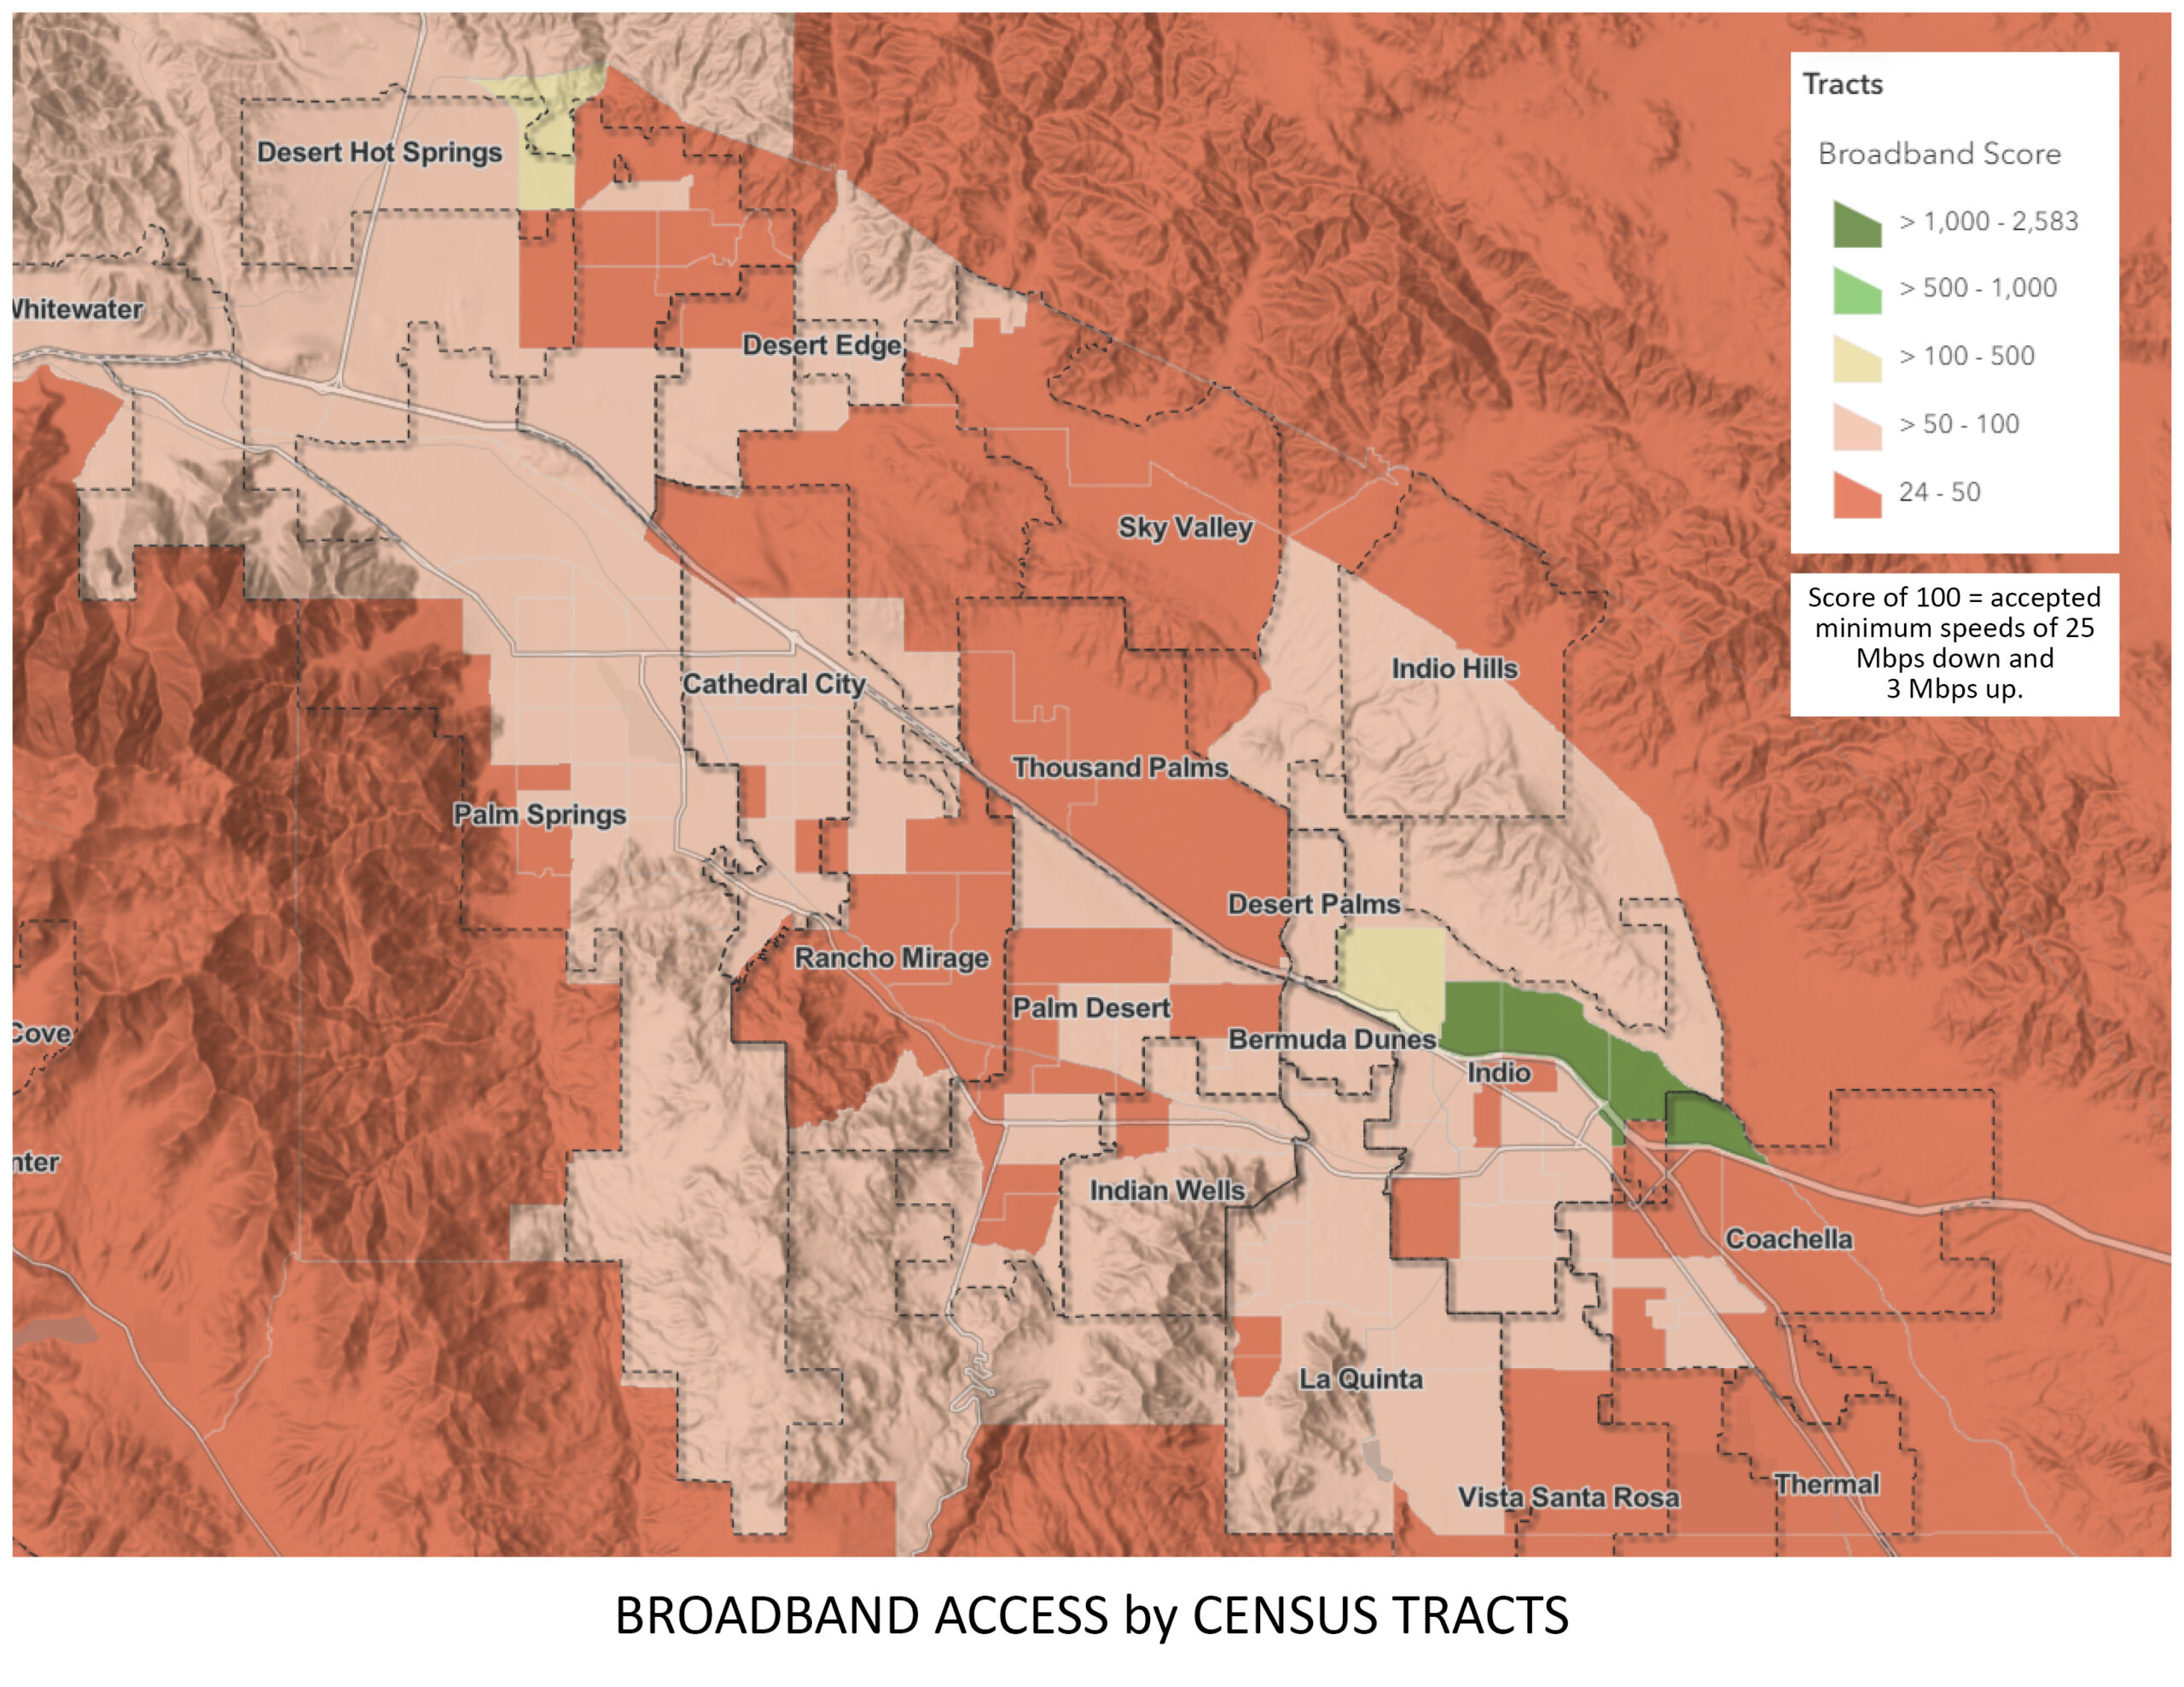 Here is a closer look at the Census tract level data for the Coachella Valley.
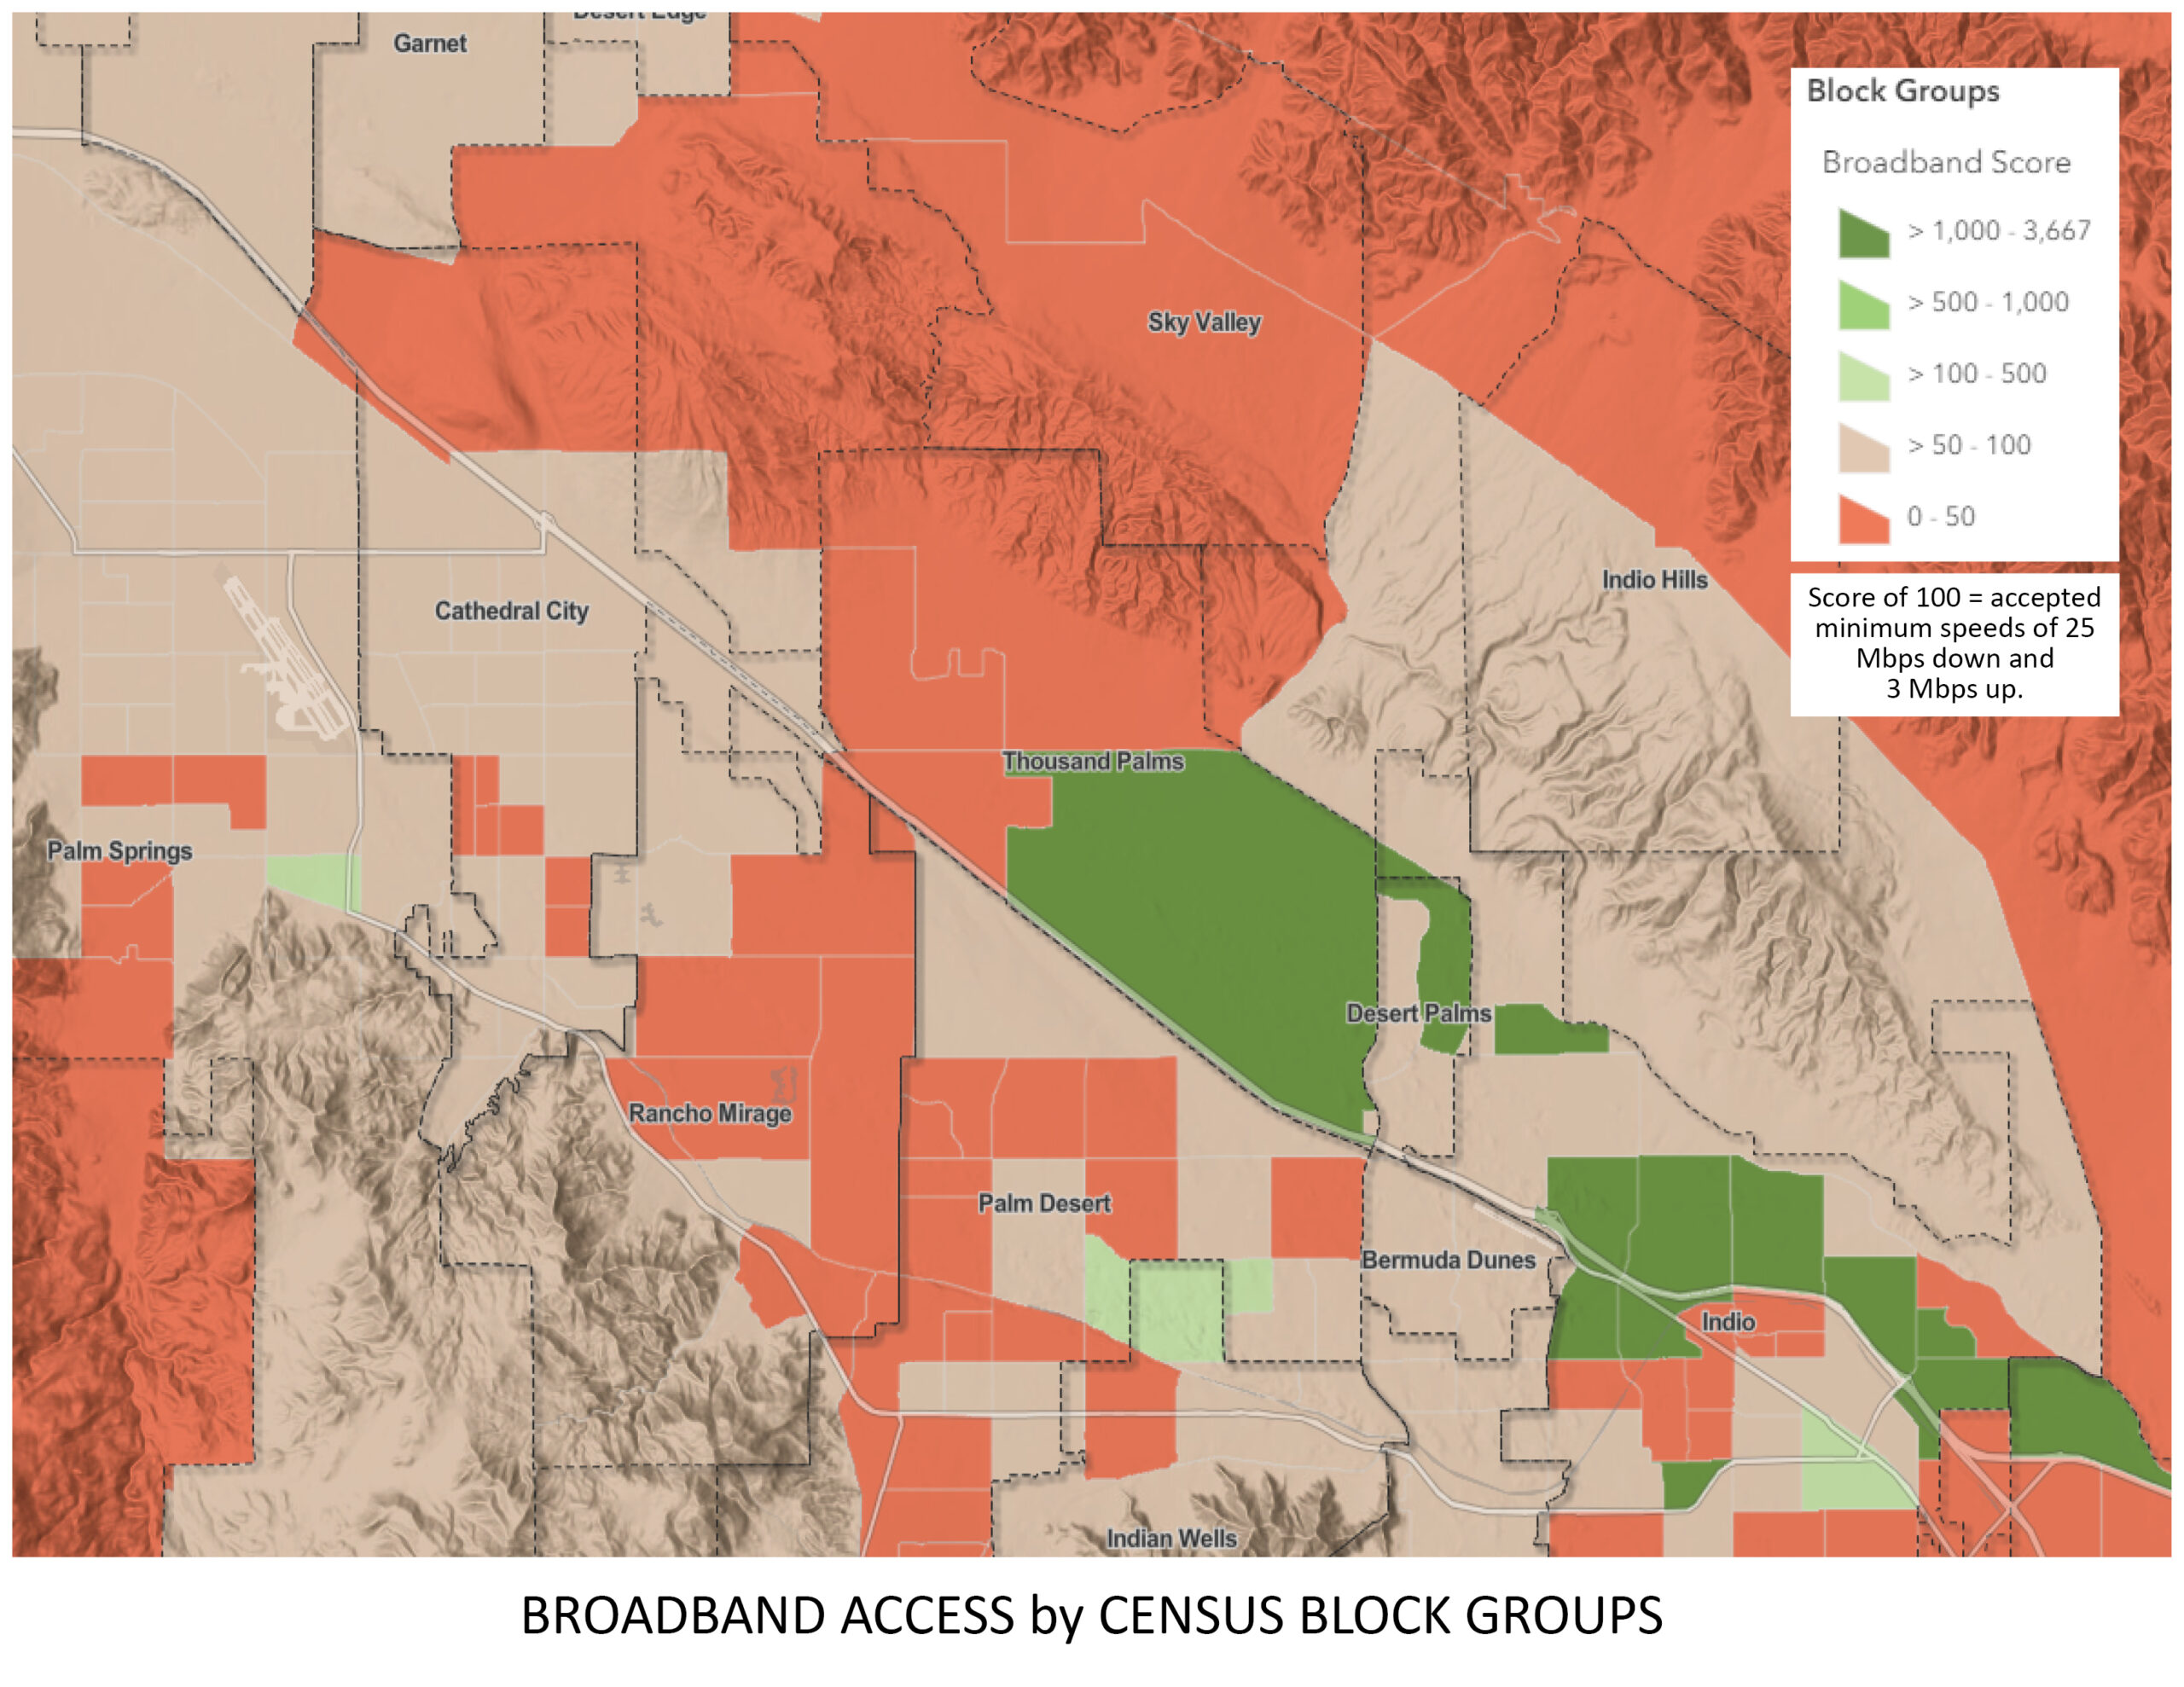 At the Census Block Group level, more areas with high-speed broadband access appear. But they remain small, isolated areas as compared to Western Riverside County.
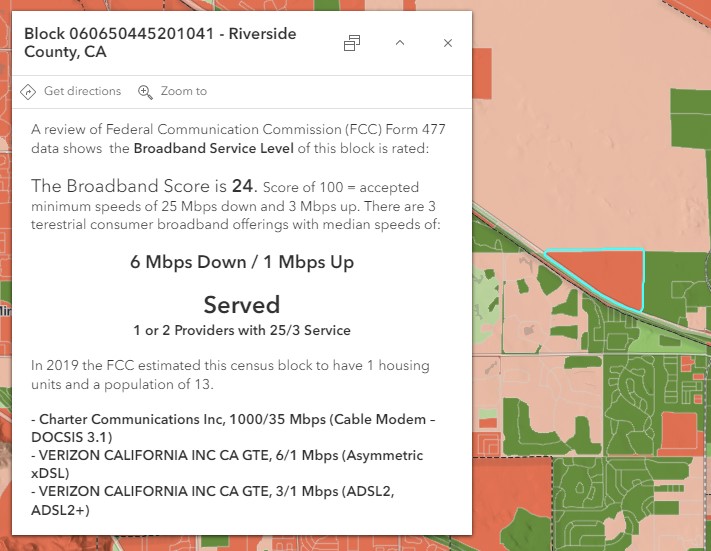
We see the most granularity at the Census Block level. This is the geographic level for which the FCC requires data for Form 477. For each geographic level, a pop-up block of text details the characteristics of broadband access for the chosen block.


