Today’s Data Digest expands on the last theme of employment inflow and outflows. That discussion centered on how many workers commuted into each city and conversely how many residents commuted out or worked in their city of residence. Here we will explore where residents work and how far they commute for their employment.
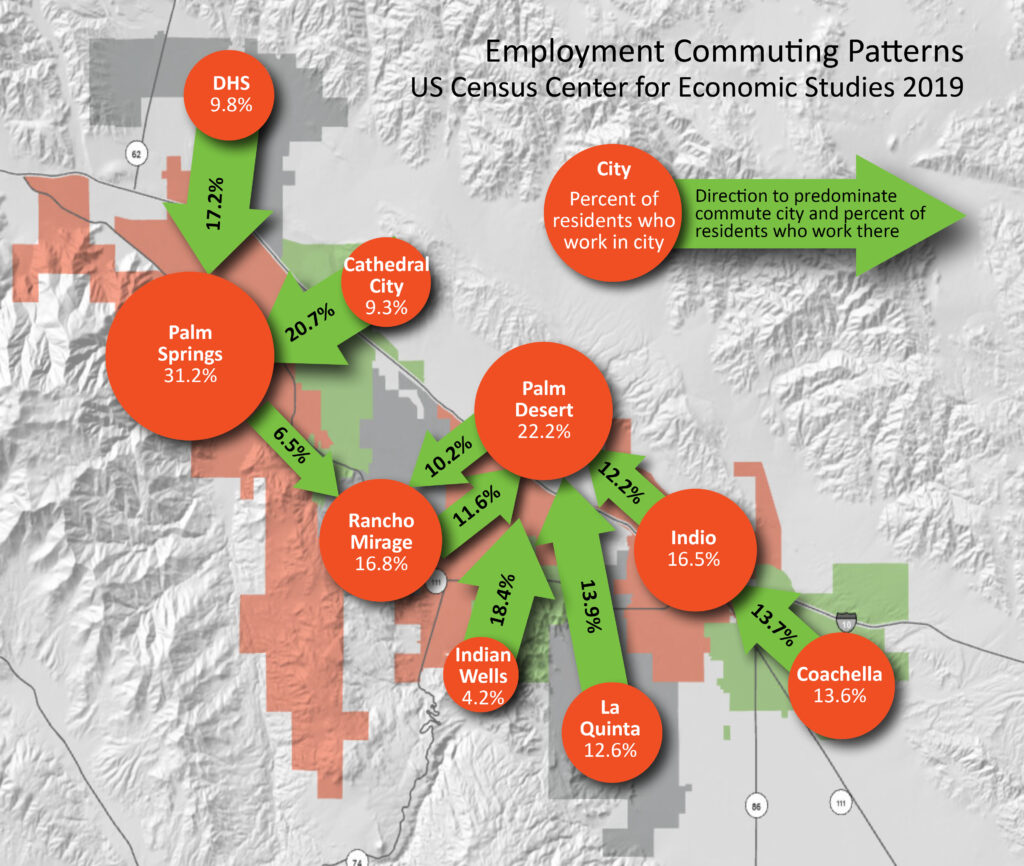
This map displays commuting flow data from the US Center for Economic Studies for 2019, the latest dataset available. The orange graduated-size circles represent the percentage of residents who work within their city of residence. The graduated-size arrows point to the city where the greatest number of residents work and the percentages of those city’s workers. Five valley cities – Desert Hot Springs, Cathedral City, Indian Wells, La Quinta, and Coachella export more workers than work within the city. The remaining four – Palm Springs, Rancho Mirage, Palm Desert, and Indio have more workers that work inside the city than the highest city to which their residents commute. Indian Wells exports the most workers (95.8%) while Palm Springs exports the least (68.8%). Palm Desert is the primary worker destination for four cities – Rancho Mirage, Indian Wells, La Quinta, and Indio.
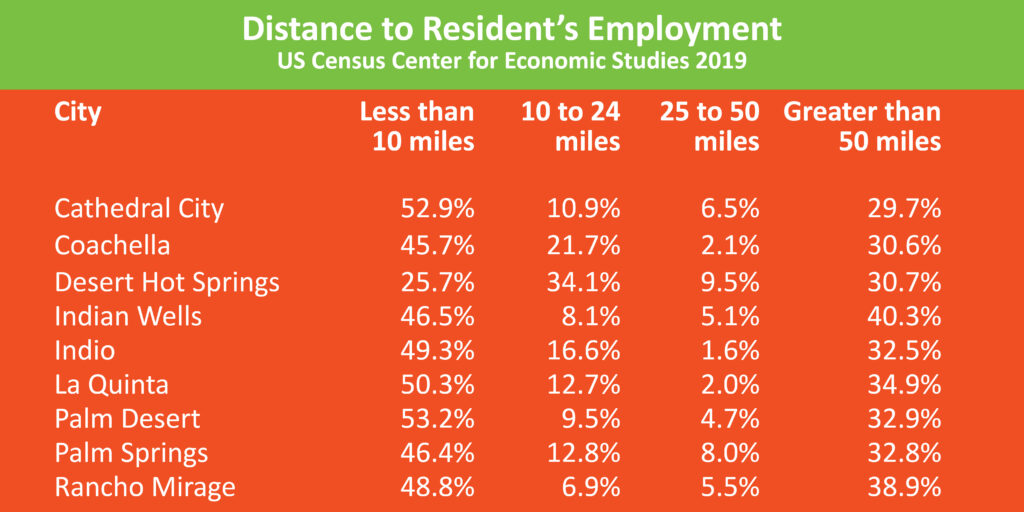
This table displays additional data from this Census report. For those residents who work outside their city of residence, how far do they commute? The table shows the percentage of workers who work certain distances from their homes, from less than 10 miles up to 50 or more miles. The Coachella Valley fares well with most cities having close to 50% of their residents working 10 miles or less from their homes, except for Desert Hot Springs at 25.7%, understandable due to its more remote location in relation to other valley cities. But more disturbing is that the next highest concentration of workers has employment 50 or miles away from their homes.
In the past, we have made comparisons of the economy of the valley with two thriving and similarly sized metro regions – Fargo, ND, and Huntsville, AL. With more diversified economies and high concentrations of STEM and knowledge work, these regions see 88% (Fargo) and 65% (Huntsville) of their workforce working within the city, with only 9% (Fargo) and 14% (Huntsville) of their residents commuting more than 50 miles.
We must note that these data are from 2019. Of course, much has changed over these 4 years. We don’t know from these data how many workers work from home at jobs centered away from their city of residence but counted as distance. COVID has drastically changed these patterns. Maybe the US Census will begin to survey these trends.
Still, the different-sized circles and arrows graphically express the interdependence of the cities and residents of the Coachella Valley. Regionalism cannot be ignored.


