

Last time we previewed extensive household income data for the Coachella Valley that will be presented at our Annual Greater Palm Springs Summit. Today we dig deeper with GIS to study these data more closely. Mapping income at large-scale uncovers patterns of income differences across the valley. We often make the mistake of looking singularly at median household income or average household income. But you learn so much more when you compare them. A large variance between median and average income for an area can imply high income disparity. Let’s see how that disparity maps to our valley.
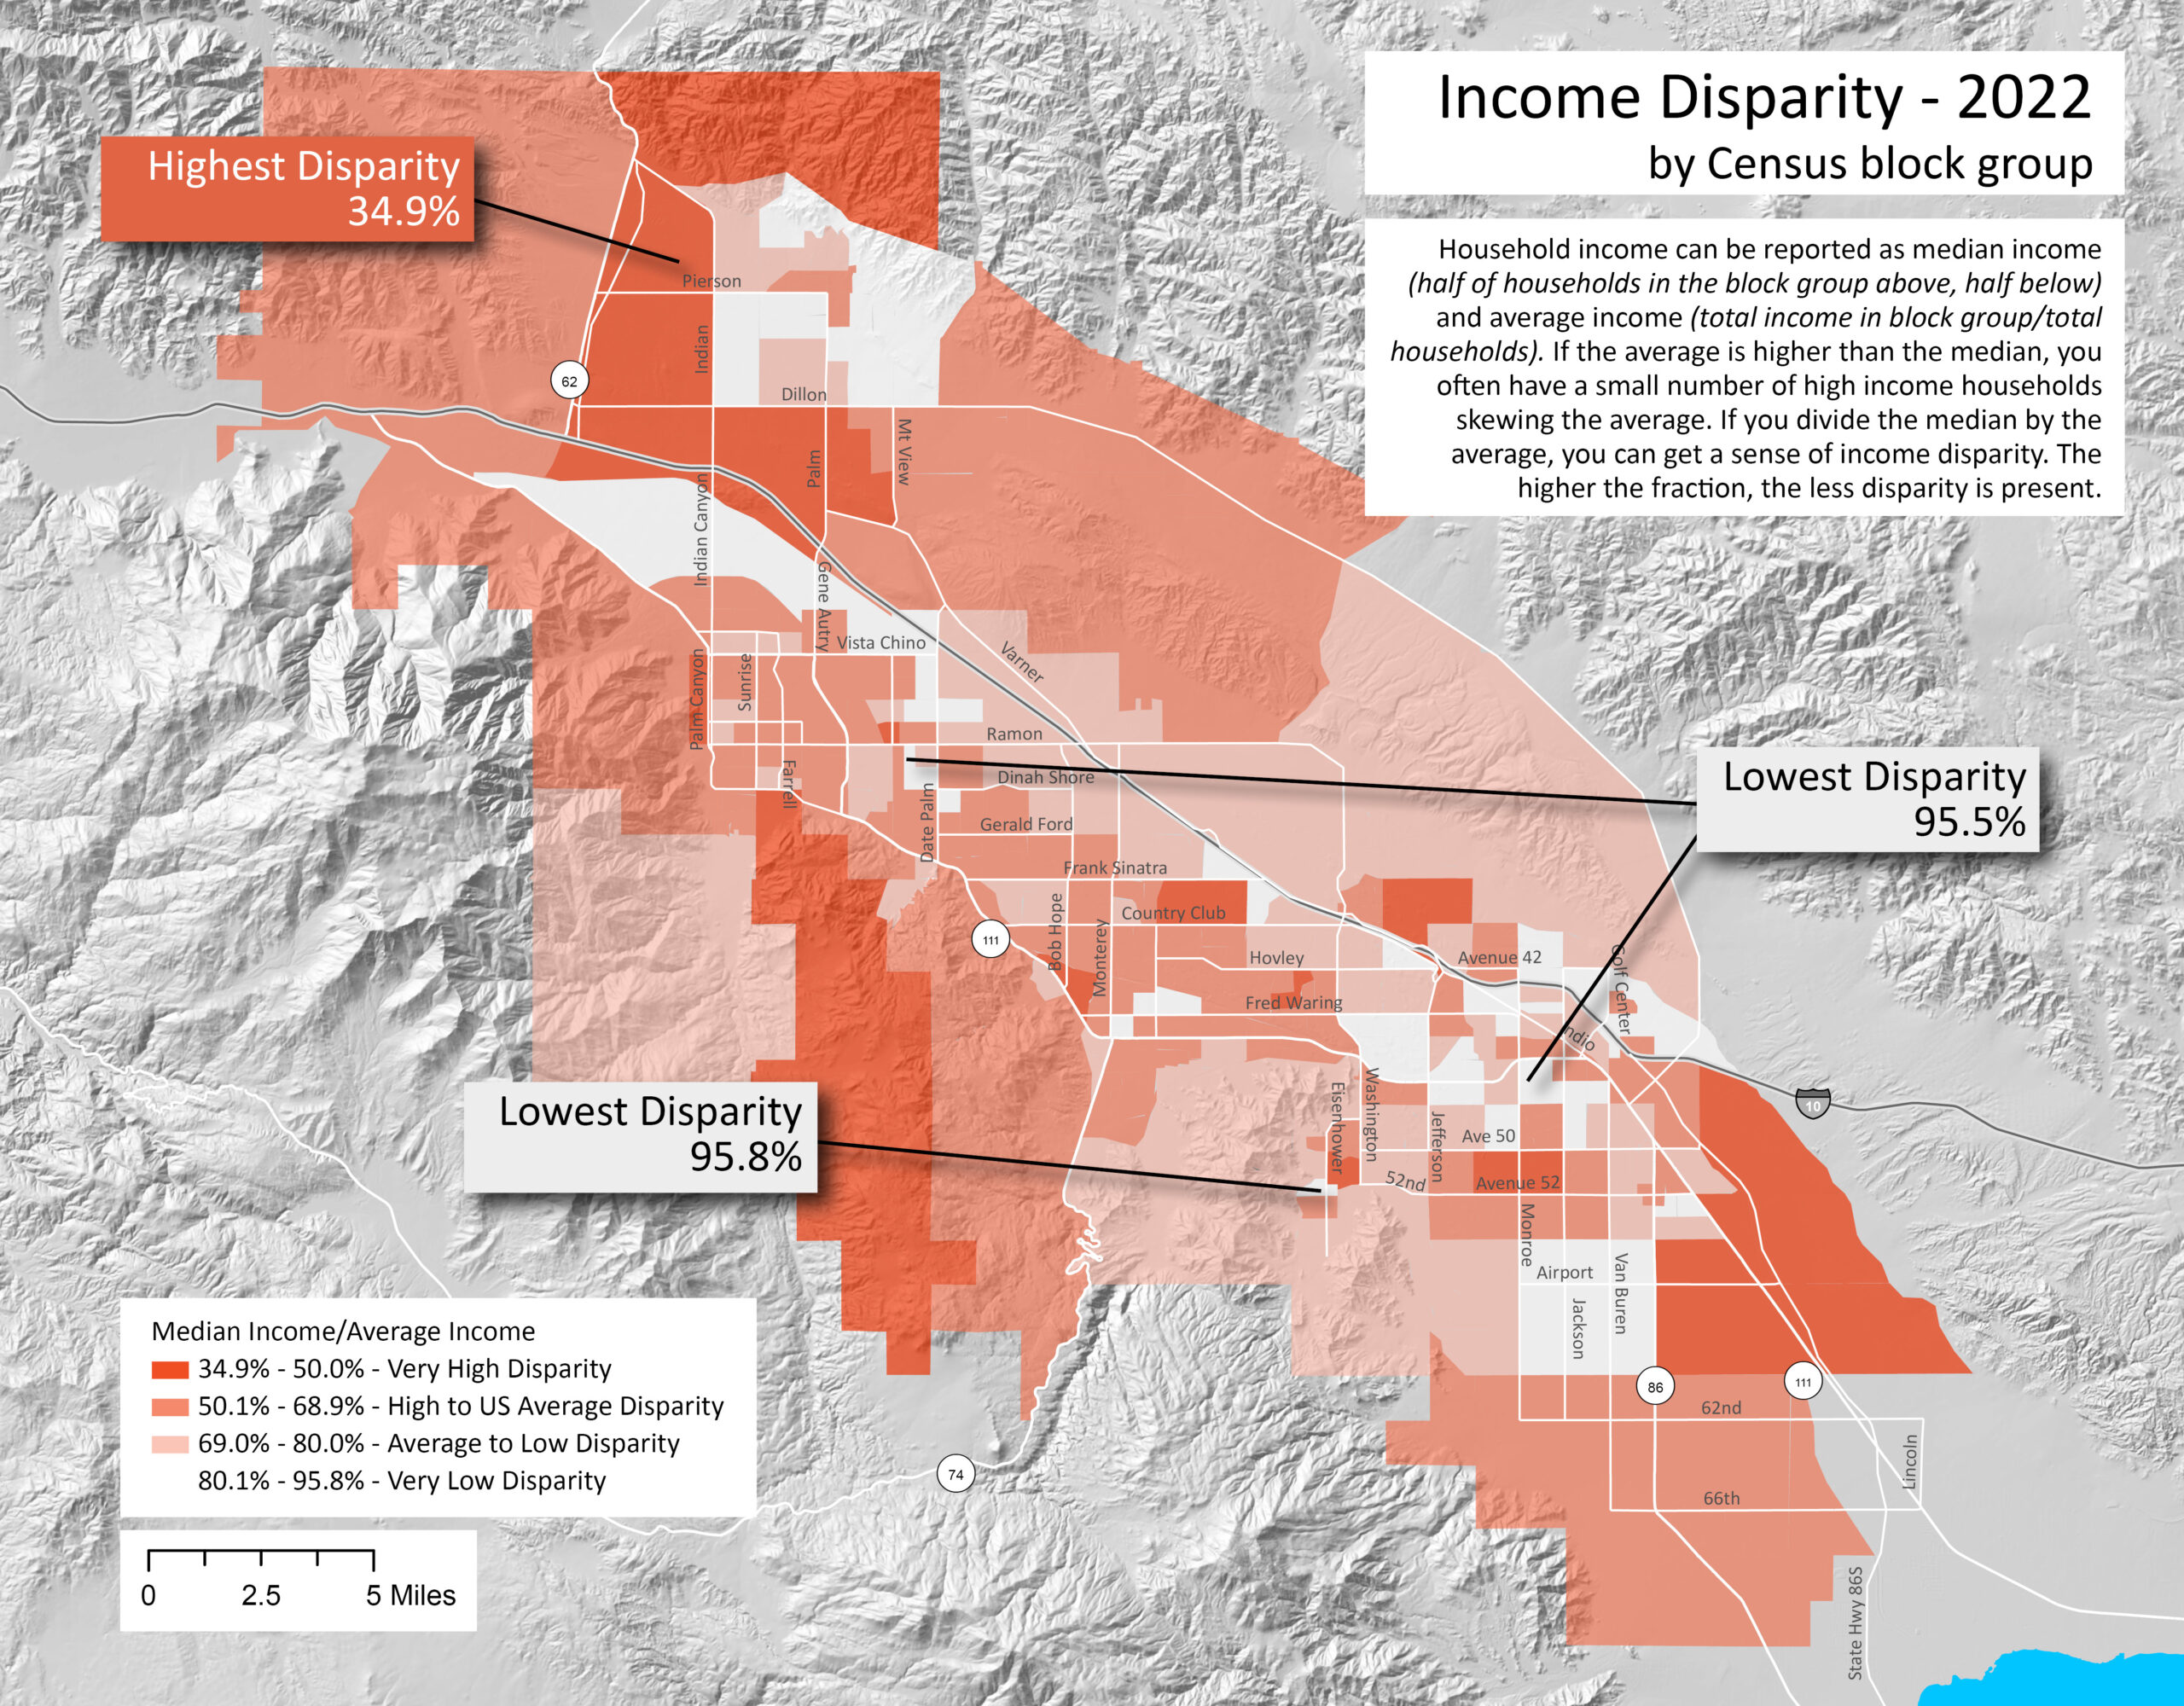
Median household income represents the halfway mark. Half of all households in each Census block group mapped above have incomes above the median income, and half have income below. When we look at average income, we add all household income and divide it by the total number of households. So, for example, if several households have incredibly high incomes they will skew the average to be higher than if they weren’t counted.
Now if we compare median household income with average household income, the greater the difference between the two, the higher income disparity we see. For this map, I have divided the median by the average for every census block group. A high fraction means that the median is pretty close to the average. In our lowest disparity census tracts, the “middle” household’s income is only about 4% lower than the average. Here we have a more homogenous distribution of household income.
But if we see a low fraction, such as in one of Desert Hot Spring’s census block groups, we observe a higher disparity between household incomes. That means that a“middle” household here has an income two-thirds lower than the income of the “average” household.
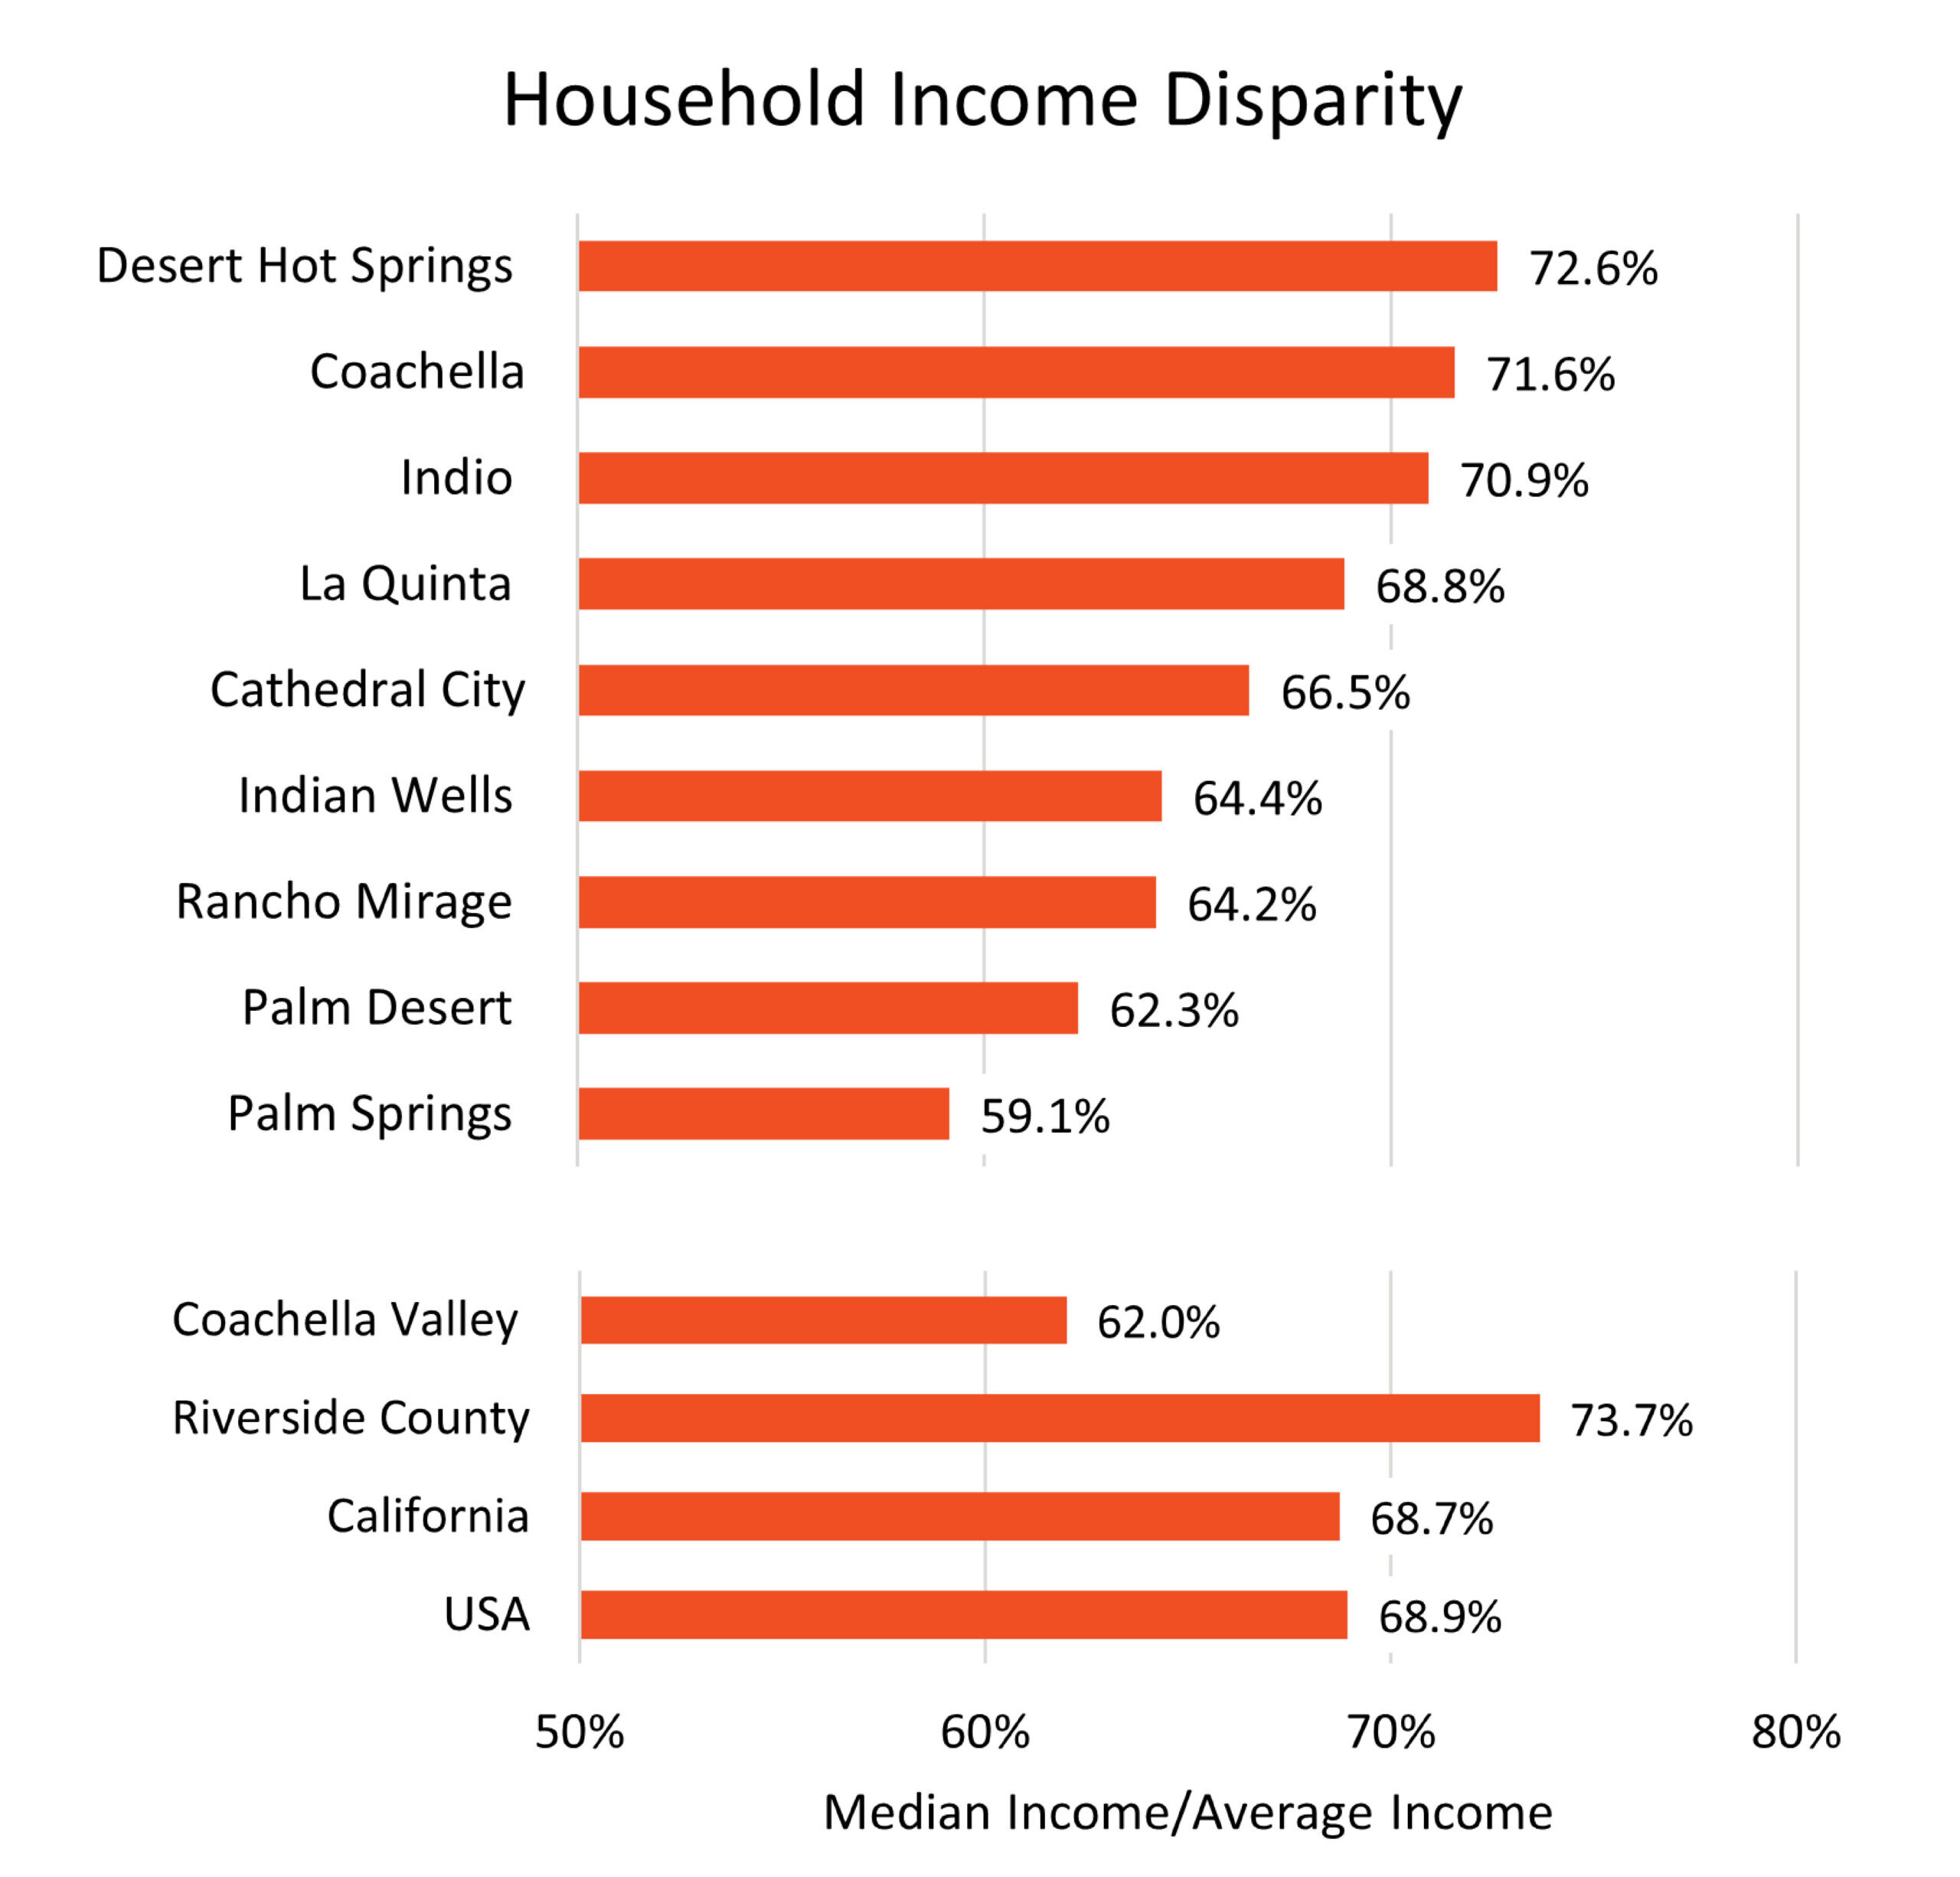
This graph shows the fraction of median income/average income for the nine Coachella Valley cities and some comparative geographies. Overall, the Coachella Valley has more income disparity than the US and California as a whole. La Quinta has income disparity similar to the US average. Note that Desert Hot Springs has the lowest overall income disparity, despite having a census block group with the highest disparity – an excellent example of the importance of looking at data at many scales.


