
The annual CVEP conference in Palm Springs was on November 8, 2018. The title of the Economic Report at the Greater Palm Springs Economic Summit was “Don’t Panic: The ‘R’ Word Angst.”
Different from previous years, I wanted to focus on the increased concern by some regarding an imminent recession: 60% of professional economists (these are the folks at Goldman Sachs, JP Morgan, Barclay’s, etc.) surveyed by the Wall Street Journal forecast the next recession to start in 2020; by 2021, this number grows to 80%. Given the economic damage that the Coachella Valley suffered during the Great Recession of December 2007 – June 2009 and its aftermath, I thought it would be useful to walk you through the various threats that the financial press perceives – in order for you to form your own opinion. In many ways, I was motivated by the title story in Fortune Magazine “The End is Near” in the August 2018 issue. Geoff Colvin, a senior editor, mentioned various signals to look out for as predictors of an imminent downturn. If you walked away from my presentation thinking that things don’t look that bad but that stories like that help sell magazines, you got the picture I was trying to paint.
I am quite certain that despite the very low positive GDP growth rate we will see for 2019:Q1, the current expansion will break the record for the longest post-World War II boom on record. But that only means the expansion will last until June 2019. What about beyond?
About two weeks ago, I presented our Inland Empire Economic Report at Roberts Pavilion at Claremont McKenna College. The title had now changed to:
Cuz Darlin’ Can’t You See my Signals turn from Green to …
This was a reference to the Jimi Hendrix song “Crosstown Traffic” which I thought people from my generation would remember. But I would expect that CVEP CEO Joe Wallace would tell me that most of you do not recognize the reference since you have similar tastes like his, meaning only listening to the Bee Gees YELLOW album (“I started a joke”) and Karen Carpenter (she used to wear YELLOW T-shirts; lolzzz, Joe). Also younger people would be at a complete loss. Okay, so to be inclusive, the point of the title was that the economic signal could have turned from green to red (recession), but then I made the argument that while matters have turned for the worse since last November, at best the current signal is YELLOW (for the younger audience, think of “Yellow” by Coldplay; for Joe: “Mellow Yellow” by Donovan). To make a long story short, for which it is too late, the most recent information we are getting from economic data are some serious warning signals.
What has happened since November – or better late summer for which we had data available at the Coachella Valley conference? The signal most of you observed was the behavior of the stock market. The post Trump election stock boom basically ended in February 2018 and we have seen increased volatility in the stock market since then. Particularly disturbing was the 15% drop in December 2018 coinciding with the government shutdown. However, that did not qualify it as a bear market (20% decline): we are still in a record setting expansion of stock prices. Also note that in order for the stock market to give us a relatively clear signal of an upcoming recession, prices would have to fall for three consecutive quarters. This has not happened; and even if it did, the stock market has had quite a few false positives (“predicted 13 of the last 7 recessions”). As a matter of fact, the first quarter of 2019, which just ended, has seen the best growth in stock prices since the Great Recession. On March 29, the index was just 3% below its all-time high reached on September 21, 2018, basically two weeks before our Palm Springs meeting. Nervous? Should be…perhaps. Well, at least more so than in November, but nothing to worry about – yet. Phew. What else?
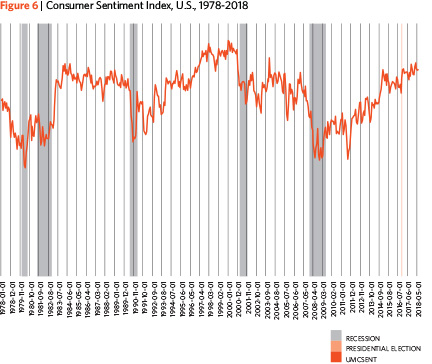 Another one of the forward looking measures, consumer confidence, is constructed by the University of Michigan (Consumer Sentiment Index). Consumers are surveyed regarding their attitude towards future purchases of consumption goods. As with the stock market, we saw a post-election boom in this series. However, the December 2018 (after our Palm Springs Meeting) publication indicated that the index had declined slightly for November 2018. That small loss corrected itself for the December 2018 survey, before really heading south in the January 2019 survey. The January publication reported responses for December, when the government shutdown began. The University of Michigan, on its website, says that they had received a record number of comments turned in with the survey (almost every fifth respondent decided to add comments) and those responses reflected concerns regarding the government shutdown. Hence the hope was that the February publication would return to the old levels seen prior to the crisis. That did not happen – the index made up only about 30% of the previous decline. What do we make of this? “Yellow” again.
Now to one of the most solid signals for an upcoming recession: the yield curve – or the difference in interest rates between the 3-Months Treasury Bill and the 10-Year Government Bond. There is a fairly strong track record that when the yield curve inverts, meaning the long-term interest rate falls below the short-term interest rate, we are on our way to a recession. Since 1970, or for the last seven national recessions, this happened, with only a single false positive in 1966. By the time of our November Palm Springs meeting, the yield curve had become flatter but had not inverted.
Well, on March 22, much earlier than forecasted by most pessimists, the yield curve did invert, and stayed negative until March 28, before becoming slightly (0.01) positive again on March 29. Optimists, like us, forecasted that it would not invert over the next two years, or better, that the Federal Reserve would not let this happen. But hold on, first of all going negative for a few days is not sufficient enough – to be on firmer grounds, we would want to see it negative for a least quarter, on average. That has not happened and if the yield curve turns negative again, then 2019:Q2 would be the earliest starting point. However, if that were to occur, then the average time lag between the event and the onset of a recession is slightly over 10 months – putting us into early 2020. Even then, there is some variation which could be as short as 5 months (December 2019) to 16 months (November 2020).
Bottom line: this is a flickering yellow light – meaning pay special attention here.
We have done three so far: stock market, consumer sentiment, yield curve – but there were three musketeers plus d’Artagnan… Here is the one I focus on the most: the index of leading economic indicators (LEI) calculated by the Conference Board. It is a weighted average of 10 economic variables, including the three we just talked about but in addition, average weekly manufacturing hours, average weekly initial claims for unemployment insurance, manufacturer’s new orders for consumer goods and materials, new orders index, manufacturers’ new orders for nondefense capital goods excluding aircraft, building permits, and a leading credit index. Our work shows that you should focus on the LEI going down for three months in a row. Should that happen, then expect a recession to start, on average, half a year later.
What is the recent evidence? Well, the LEI decreased from September 2018 to October 2018. It then recovered slightly for November 2018 before declining again slightly for December 2019. So, it went down two out of three months, but not quite three months in a row. For January 2019 it remained the same, before improving slightly for February 2019. What do we learn from this? Yellow light flickering, pay increased attention. Like the Yellow Rose of Texas, Joe.


