

Back in the spring of this year, Visit Greater Palm Springs reached out to us. They were updating their original 2017 Non-Primary Residence by Location of Owner study and asked us to be part of the team. The study analyzes Riverside County Assessor Property data. A list of residential properties with different mailing and property addresses was compiled. This creates a proxy for a list of non-primary residences in the valley – those residences where the owners’ Coachella Valley residential property is not their primary mailing address. Visit Greater Palm Springs recently published their final report, 2021 Non-Primary Residences by Location of Owner.
CVEP, like many agencies and businesses in the Coachella Valley, struggles to obtain accurate data about the extent and demographic profiles of our Snowbird population. The problem is this elusive group is not homogenous. Some are remote owners, some rent. Some come early in the season, and some go back home as soon as the first 90 degree day hits. Some drive to the valley in their own cars, some fly into our iconic Palm Springs International Airport (PSP). To obtain an accurate and statistically reasonable count of snowbirds would be a complex and expensive proposition.
So studies like Visit Greater Palm Springs’ Non-Primary Residence study gives us important insights into the geographic distribution of CV second-home owners. As CVEP’s GIS (Geographical Information Systems) expert, these kinds of locational data are GIS gold. If I know where someone lives, I can tell you a great deal about them.
I encourage you to take a look at the final report. There are a lot of informative graphs and tables. Some highlights of our analysis include:
- 92% of properties are owned by U.S. residents, 7% by Canadians, and less than 1% by residents of other countries.
- Not surprisingly, 32% of the non-primary residences are owned by Coachella Valley residents. 28.4% are owned by residents of other Southern California regions (excluding LA County), and 27.5% are from LA County.
- Palm Desert has the most remote-owner properties at 23% of the whole valley, followed by Palm Springs at 22%, and La Quinta at 15%.
- California owners comprise 68%, while Washington state comes second at 7%, Oregon third at 3%.

This map shows the proportion of ownership by US States and Canadian Provinces
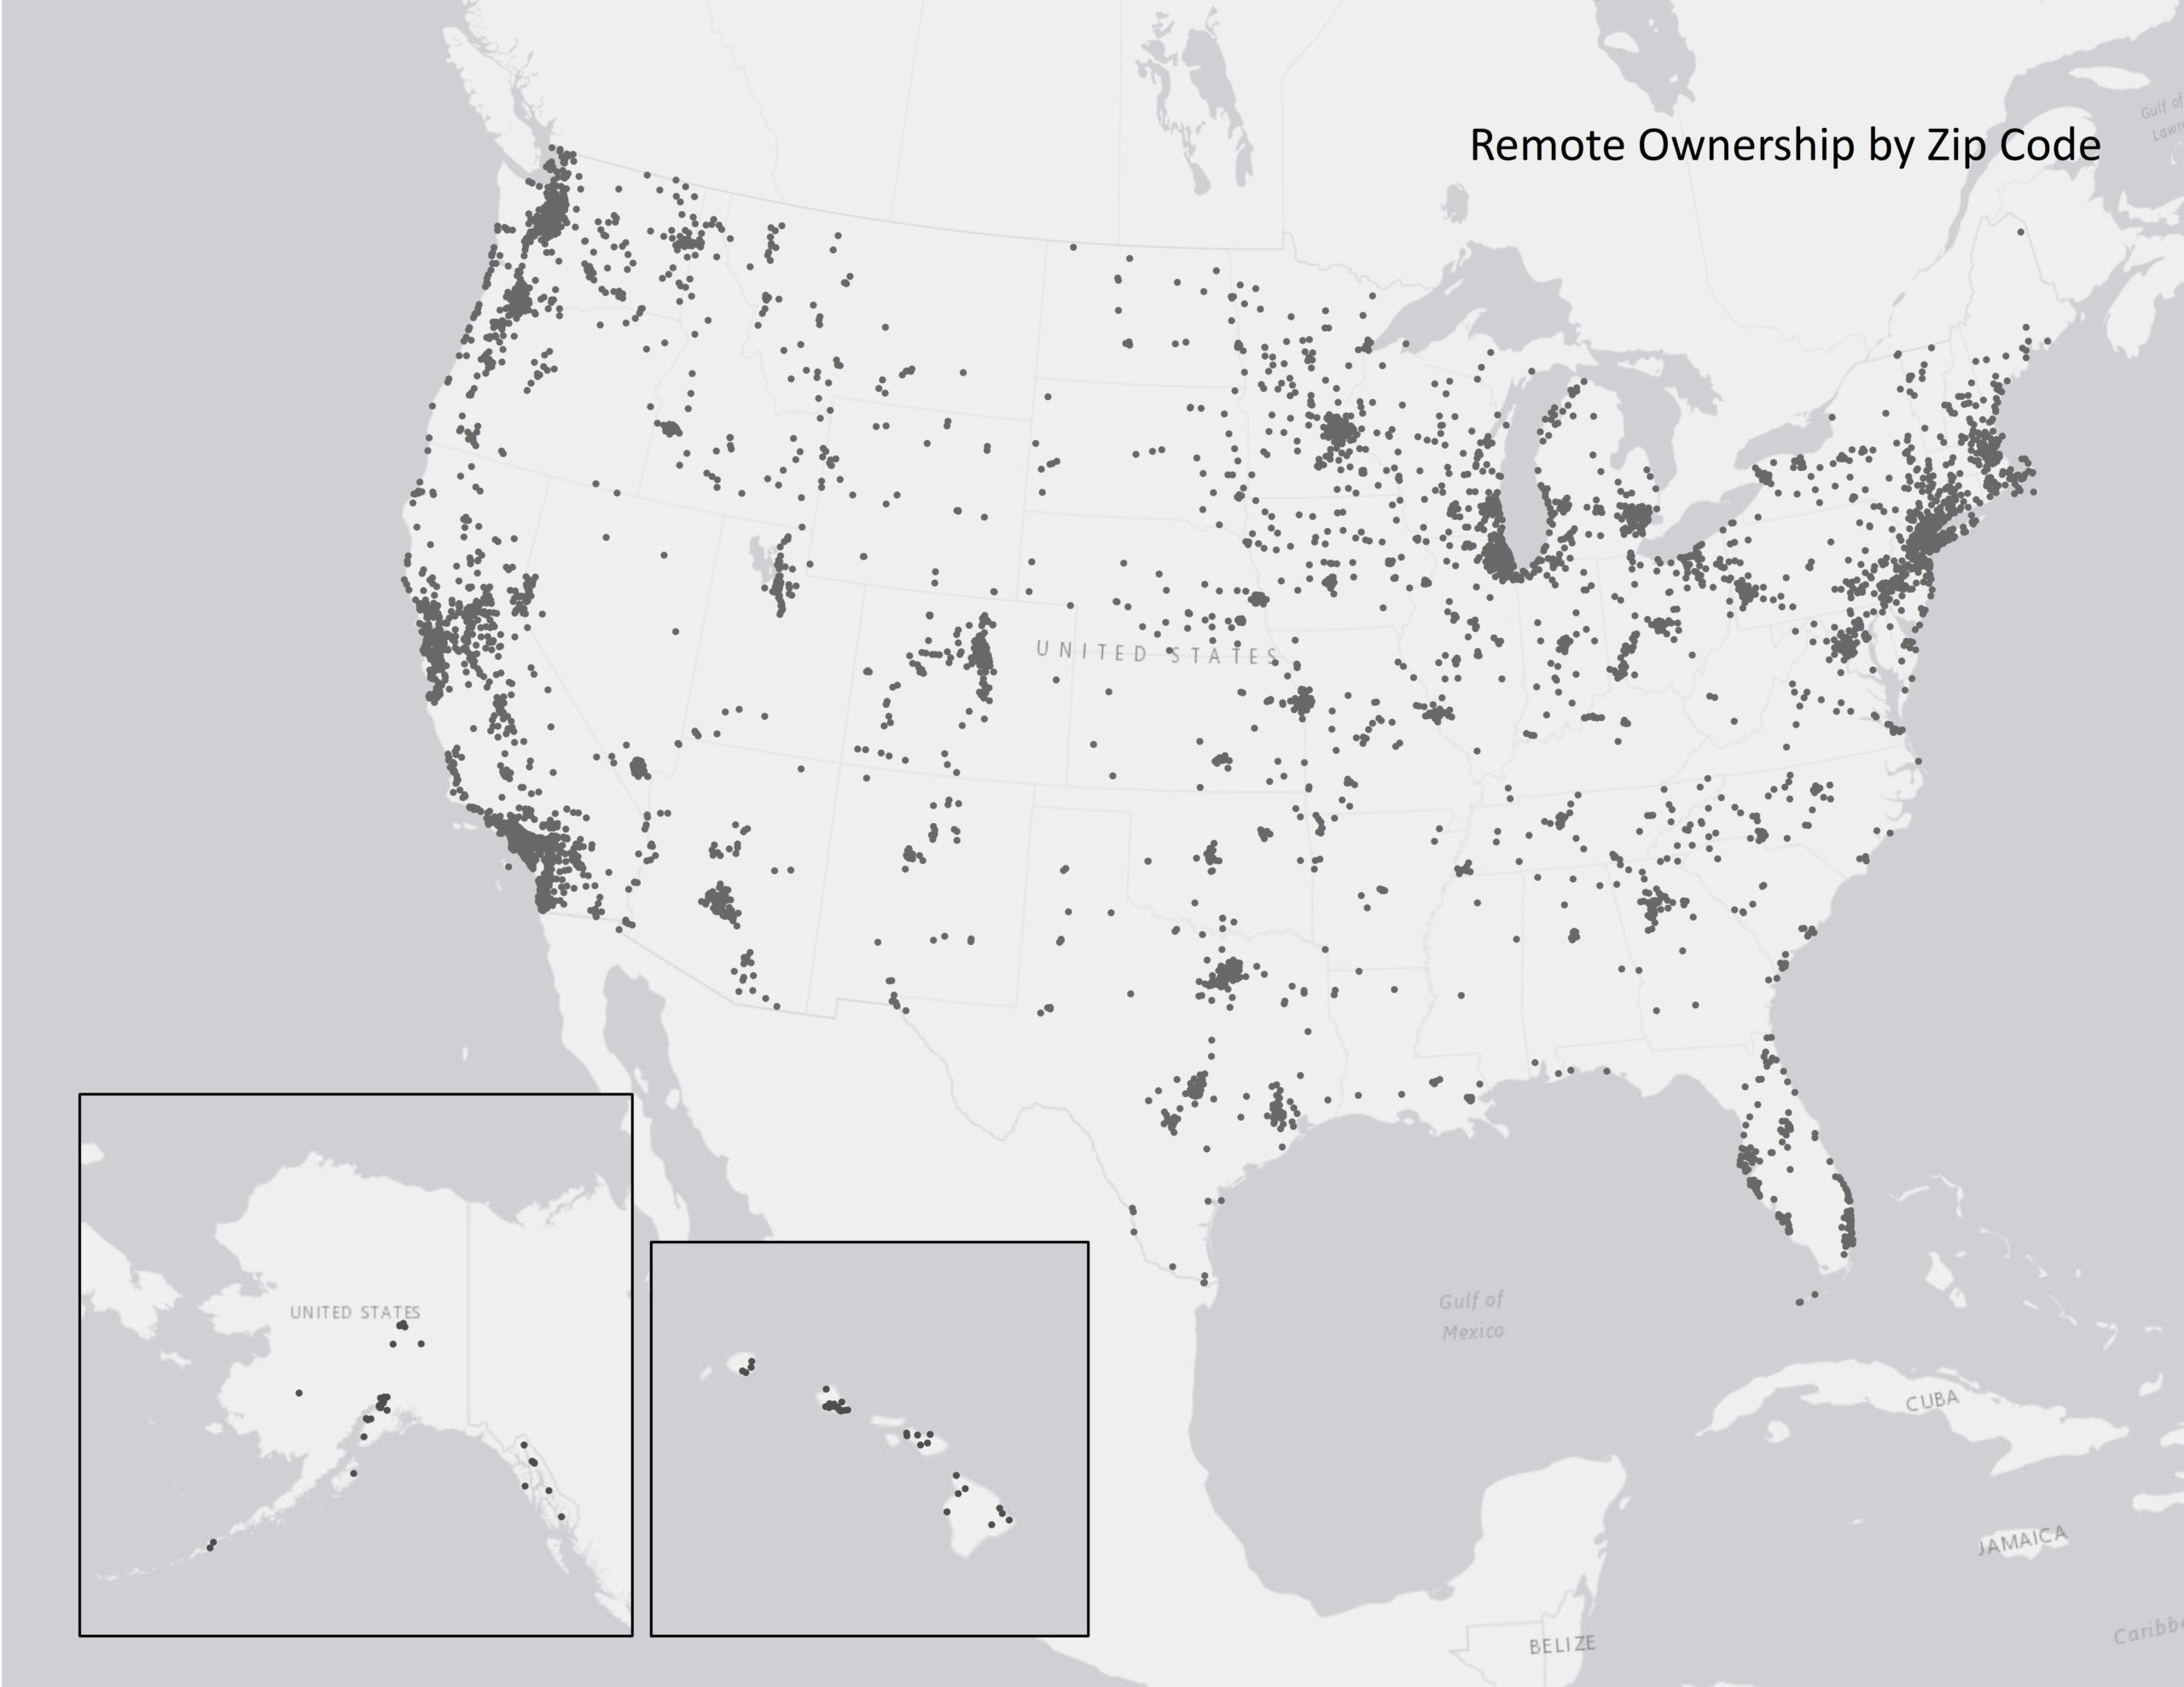
This map shows all the US Zip codes wherein a remote owner lives. Note the wide distribution of owners all over the nation, including Alaska and Hawaii
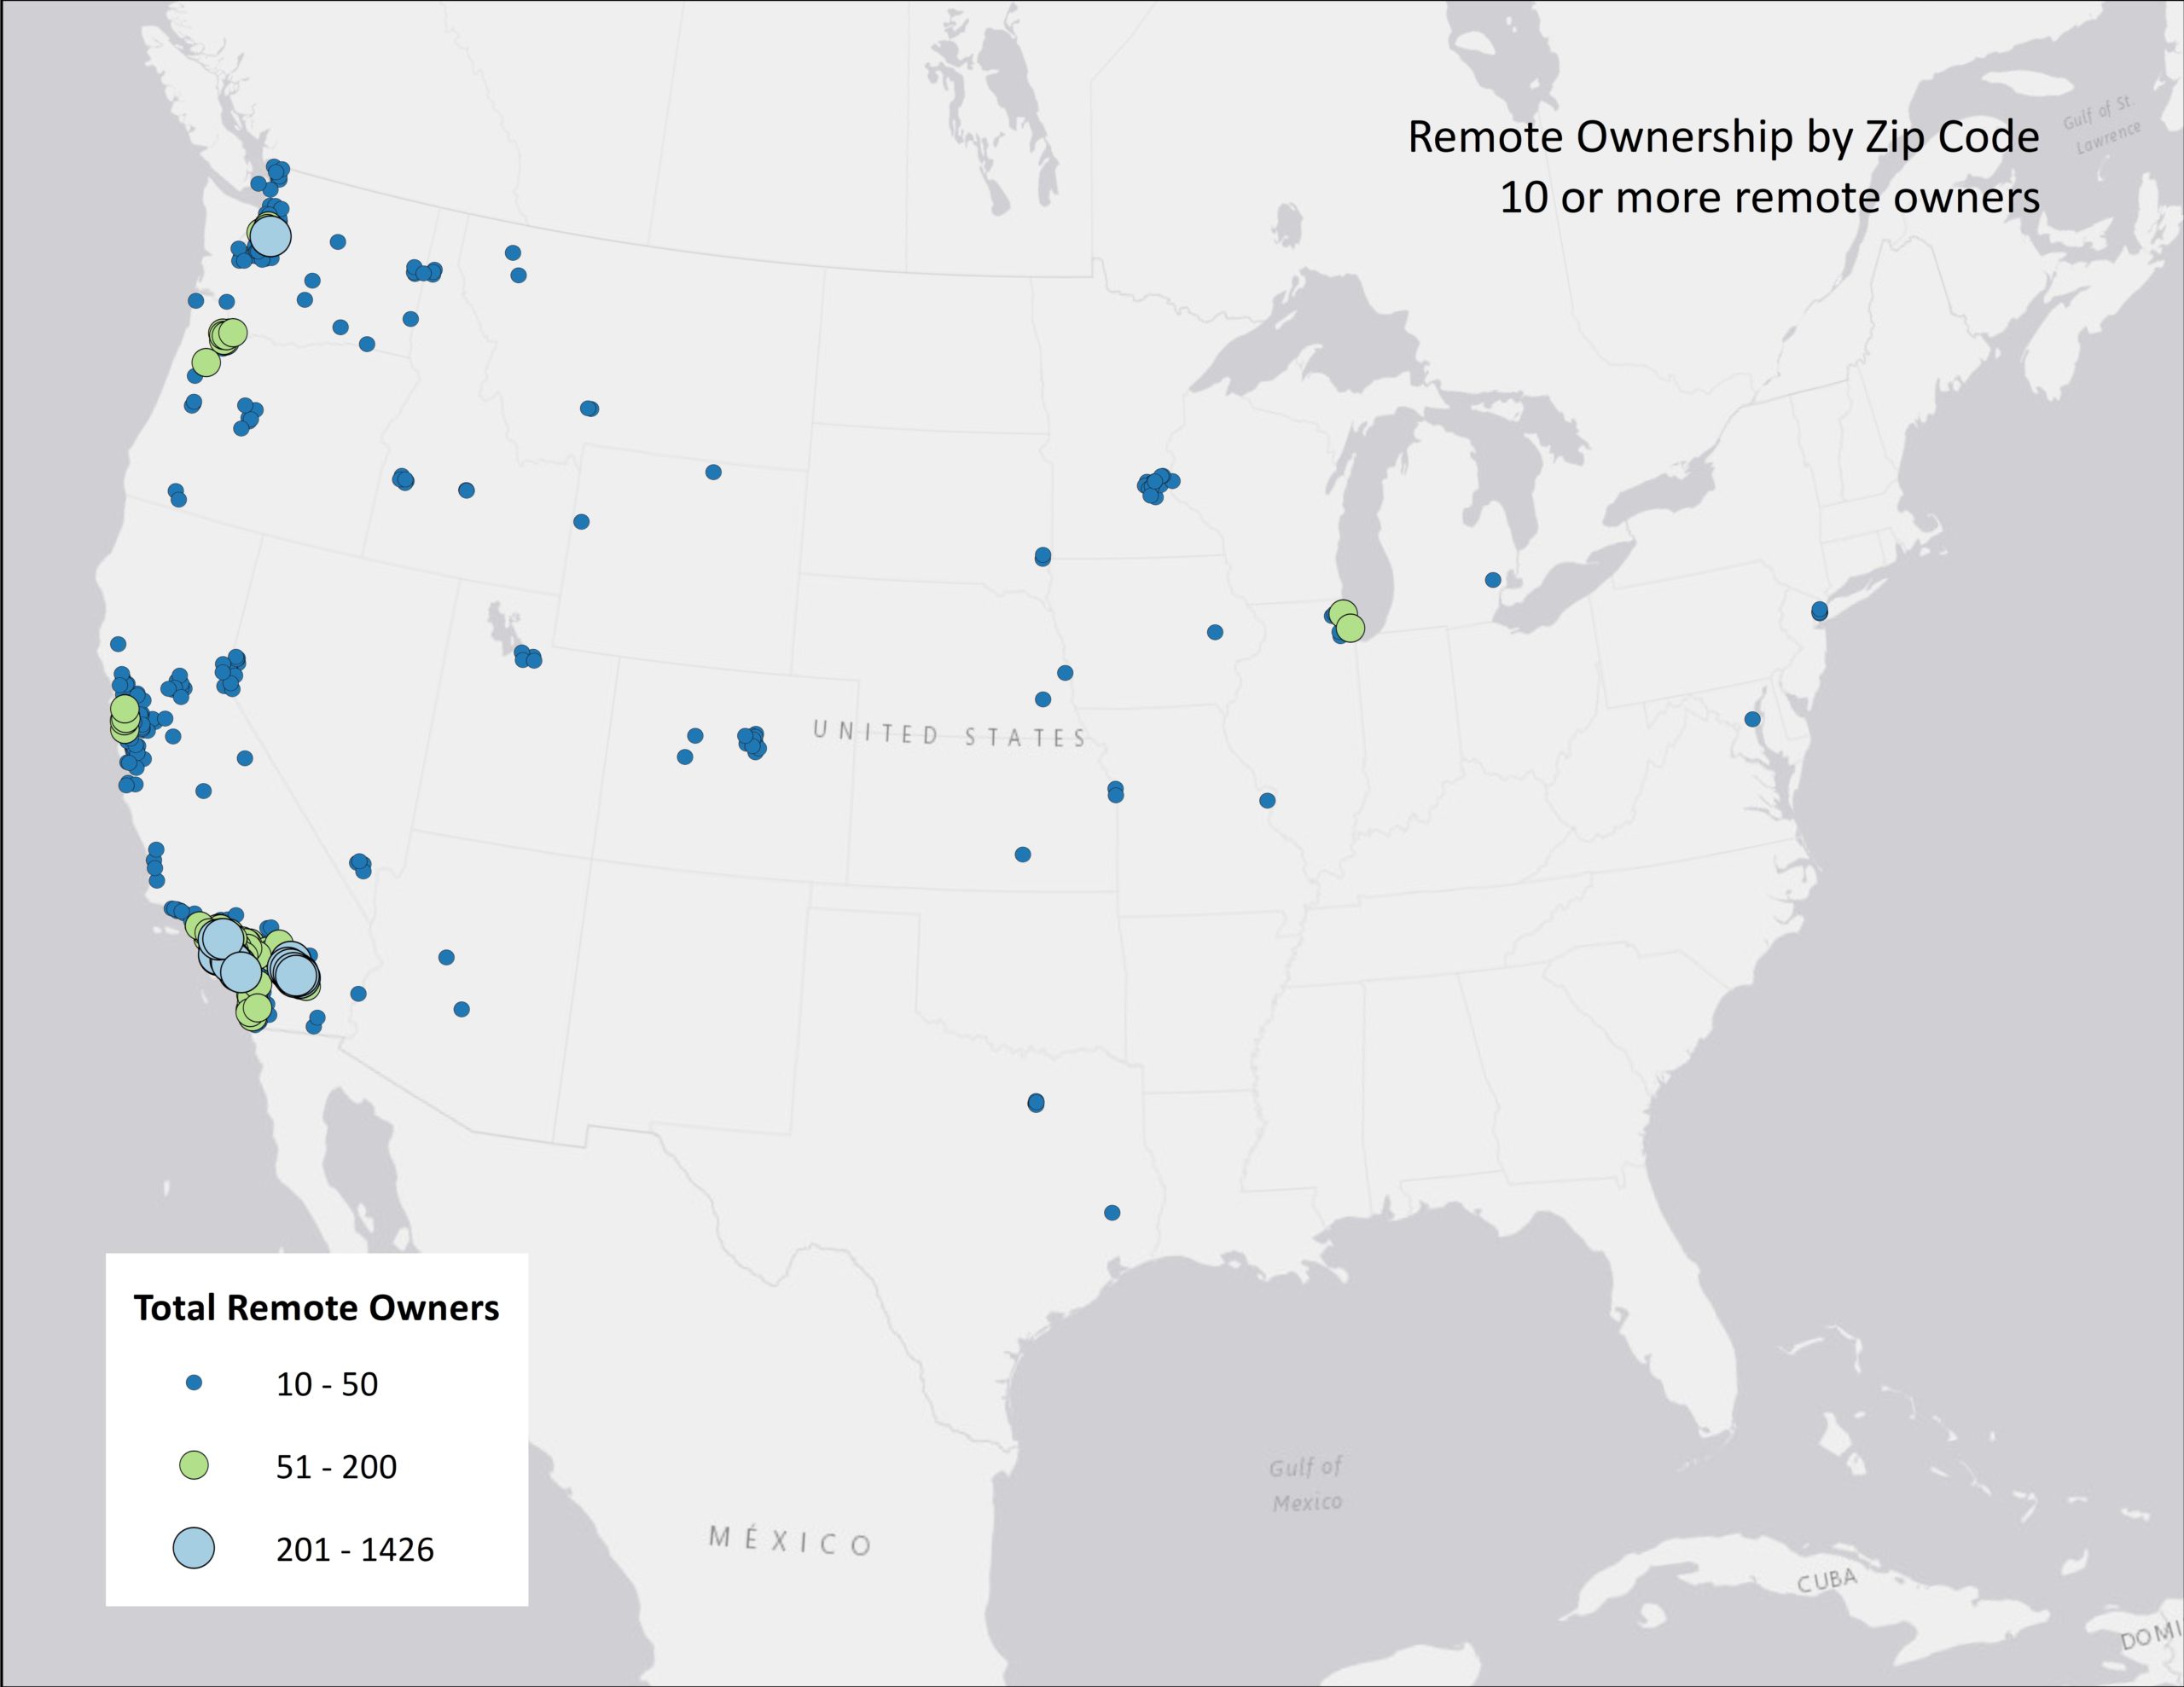
While the previous map showed all zip codes with remote owners, this one filters out those with at least 10 or more owners


