

Last week the US Census released their 2021 county and Metro/Micro population estimates. Nearly three-quarters of the nation’s counties had a natural decrease in population in 2021 from the year before. That is up substantially from 45.5% in 2019, and 55.5% in 2020. A natural decrease happens when more deaths than births occur. Of course, the COVID-19 pandemic intensified this, along with fewer births and an aging population. International and domestic migration in and out of counties also contributes to population growth or decline. Today we look at how population growth (from July 2020 to July 2021) in Riverside County and the Riverside-San Bernardino-Ontario MSA (our geographic homes in California) compared to the nation and the rest of California.
We start with the greatest population growth and decline for Metropolitan Statistical Areas (MSAs) in the US. Despite California’s recent decline in population, our home MSA, Riverside-San Bernardino-Ontario, was the fifth fastest-growing MSA in the nation from July 2020 to July 2021 by total population gain. Three of the top five were in Texas, and one was in Arizona.
But three neighboring MSAs in California, San Franciso-Oakland-Berkeley, San Jose-Sunnyvale-Santa Clara, and Los Angeles-Long Beach-Anaheim were in the top 5 US declines in total population. The New York City region and Greater Chicago shared in this undistinctive honor.
But if we look at growth as the proportional change, not actual population numbers, non of the fast-growing MSAs on the map are even in the top 20. Riverside-San Bernardino-Ontario would only come in a tie for 81st fastest growing MSA. The top 5 goes to smaller, very quickly growing MSAs in Utah, Idaho, South/North Carolina, and Florida.
Despite our local growth, three California MSAs have seen significant declines in population. Two, San Francisco-Oakland-Berkeley, and San Jose-Sunnyvale-Santa Clara are in the top 5 of cumulative population loss and percent loss.
If we change our view to counties in California, Riverside and San Bernardino Counties still represent numbers one and two respectively for total population growth. We see the greatest decline in high-priced coastal and tech counties, like our neighboring Los Angeles County.
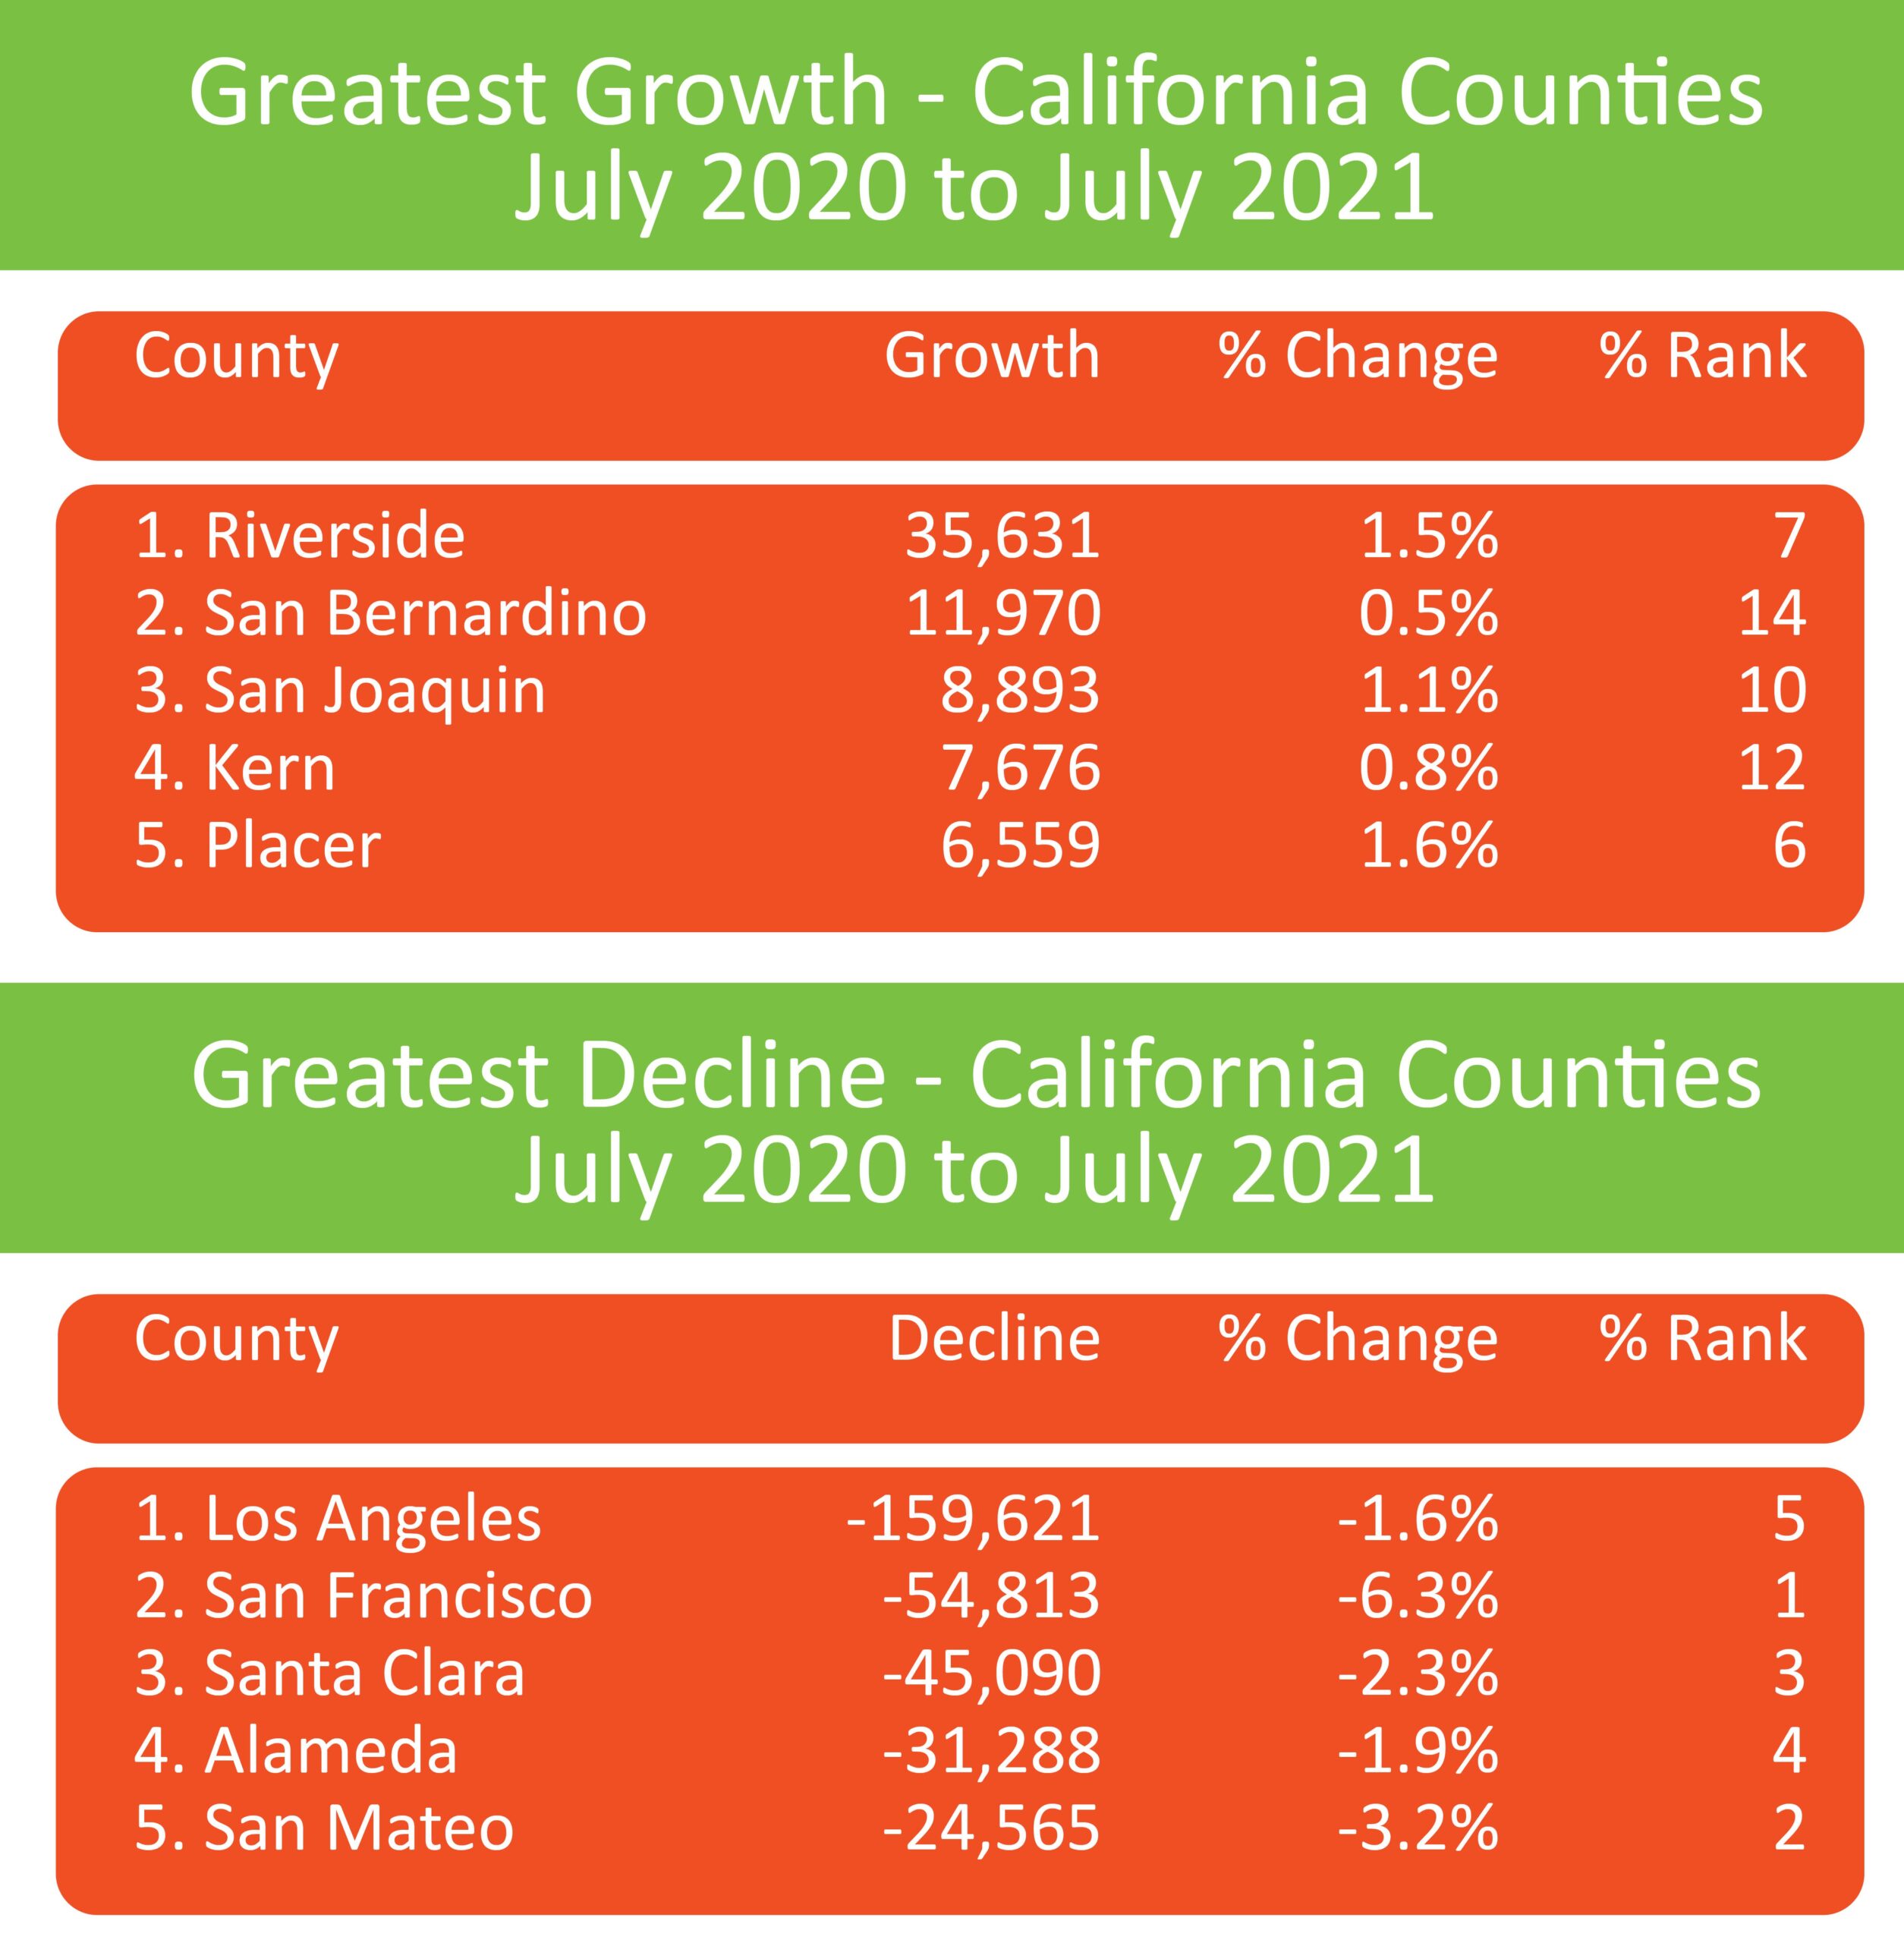
Again, if we look at proportional growth and decline, by percentage change, we see a different story. Riverside County would only be ranked 7th in growth, with San Bernardino being 14th. But the top 5 counties with total population declines still rank 1 to 5 in percentage declines as well.


