

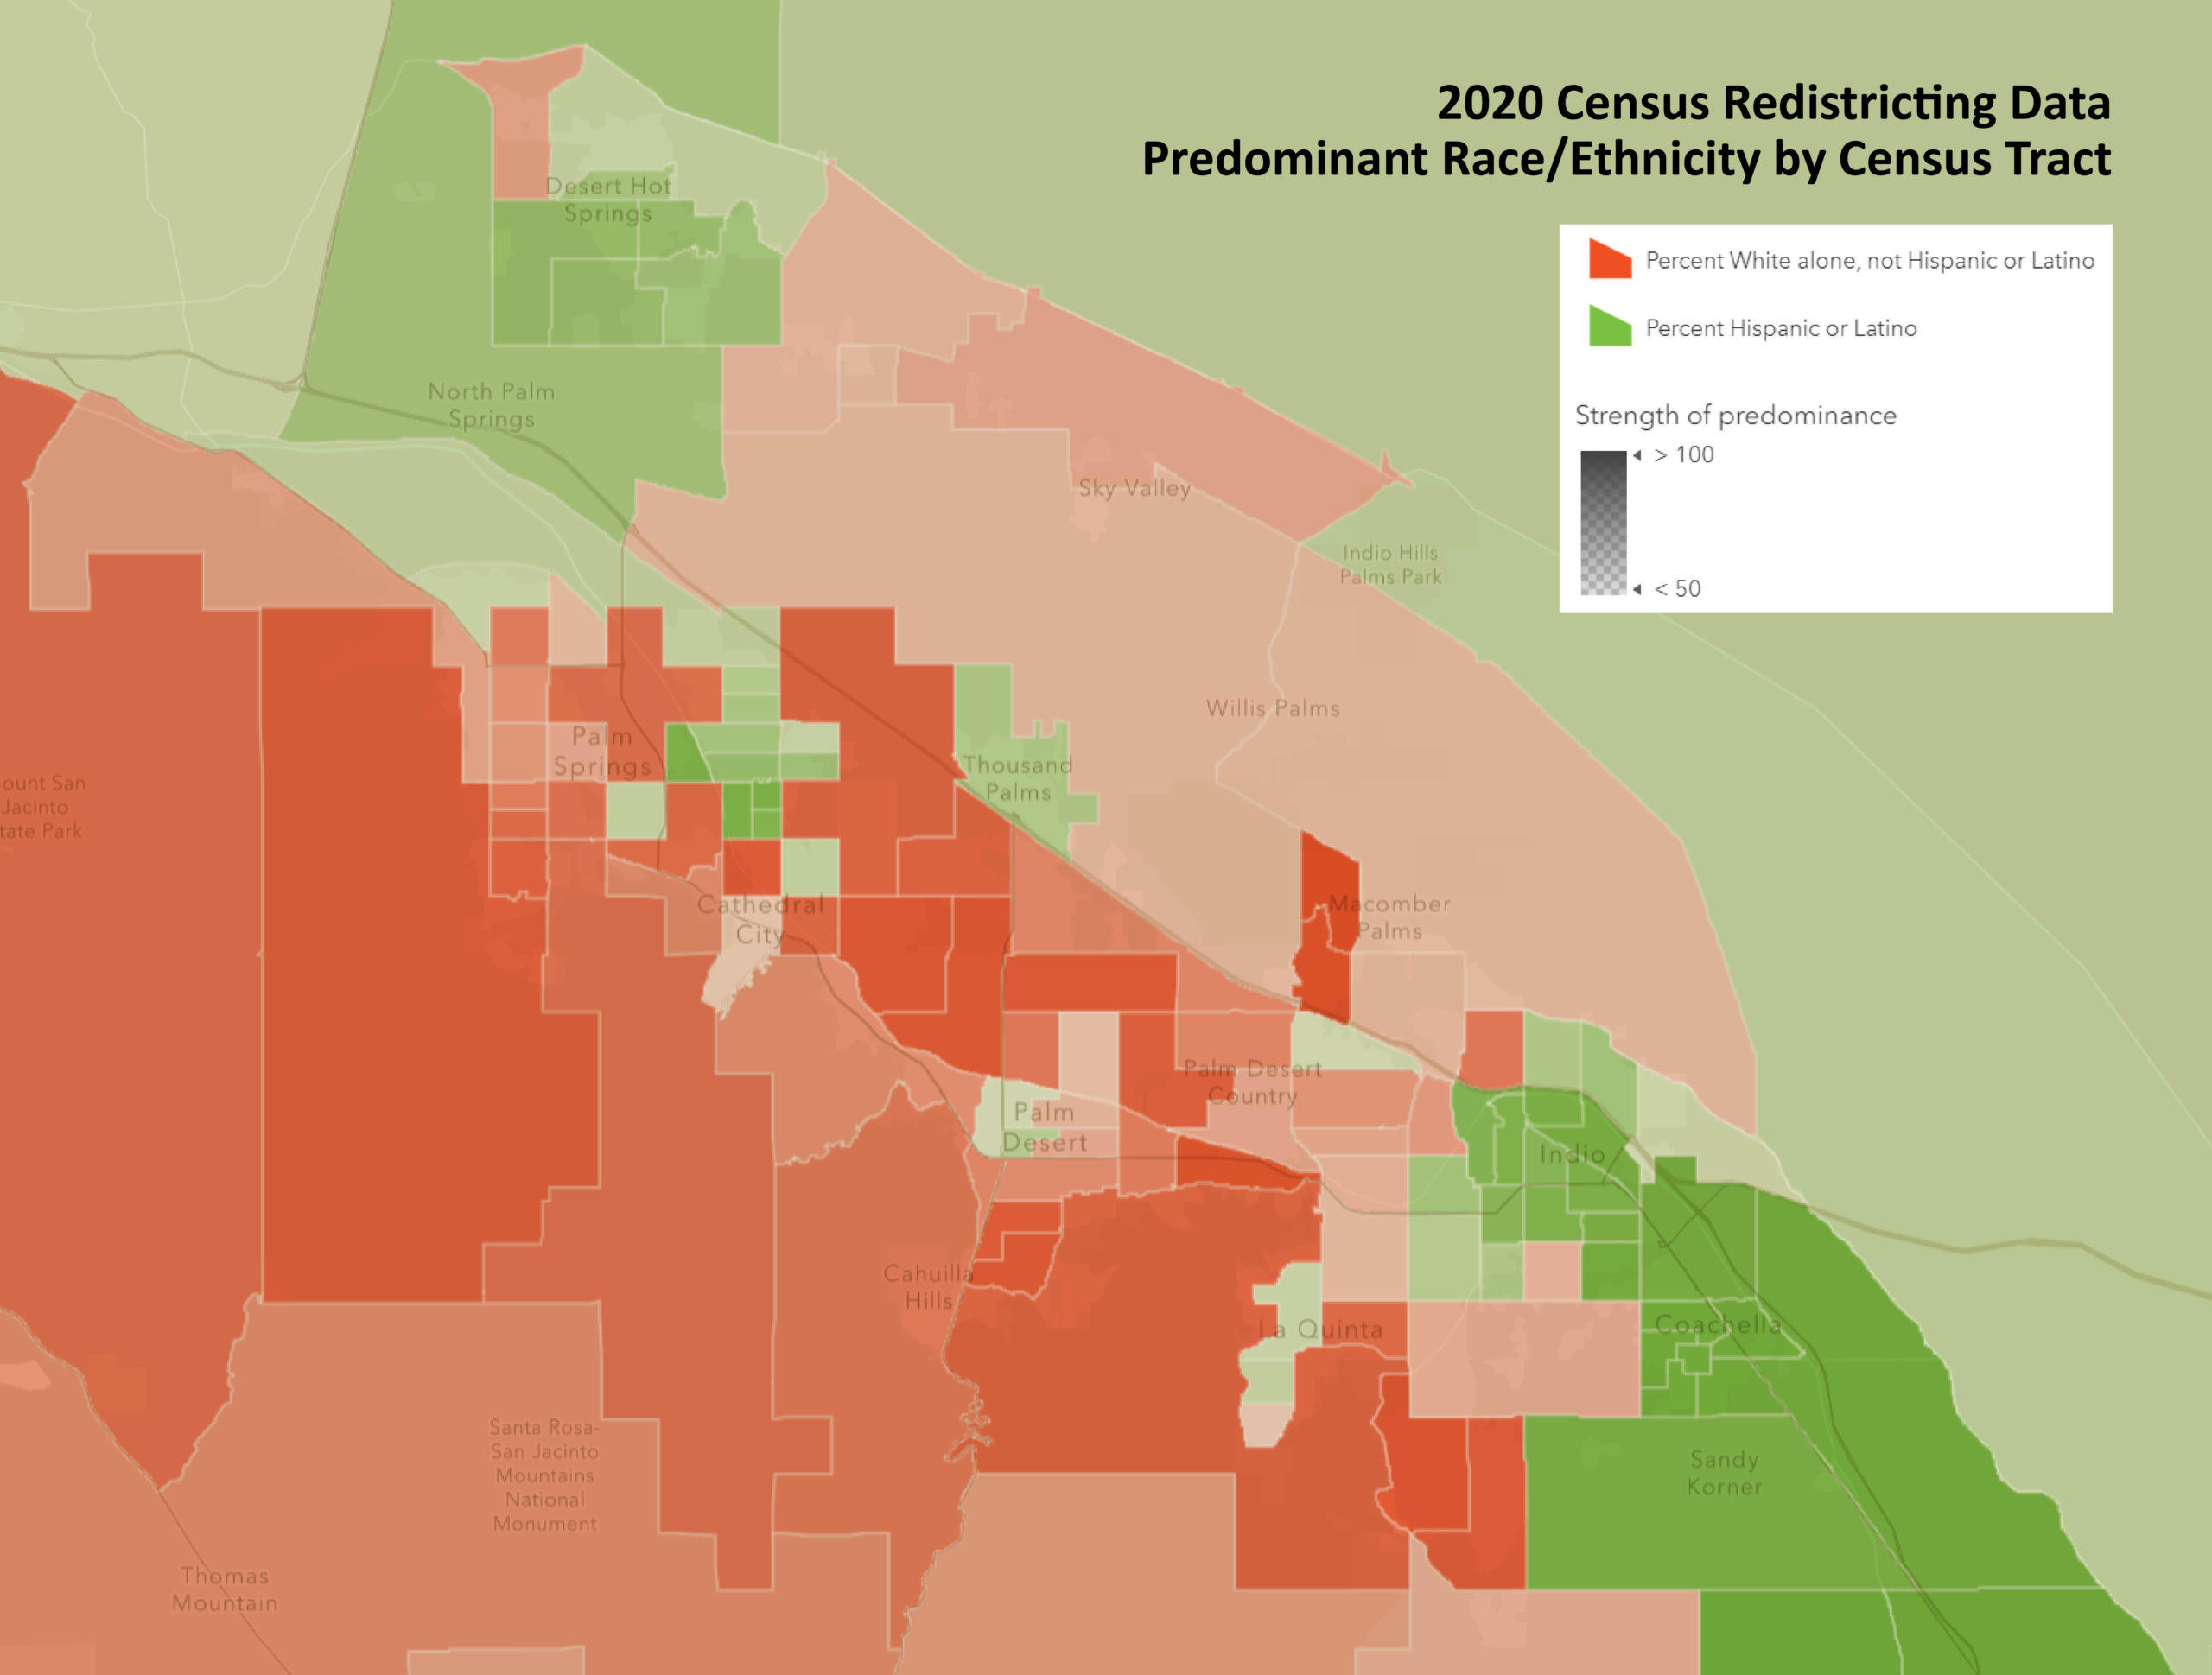
This week we continue our preliminary review of the 2020 Census results. Last week we compared 2010 and 2020 Census population and race/ethnicity data for each of the nine valley cities. Here we look at these data more granularly. This map displays the predominant race/ethnicity for each valley census tract. We do have a diverse population in the valley. However, only two race/ethnicity categories predominate: white alone, not Hispanic or Latino (red shaded areas), and Hispanic or Latino (green shaded areas). The intensity of each color represents the strength of the predominance of the representative race/ethnicity. For example, Sun City tracts show a high concentration of white alone, while tracts in Coachella show high concentrations of Hispanic or Latino.
The early findings of the 2020 Census are reported primarily for redistricting. The U.S. Census Bureau provides the 50 states, the District of Columbia, and Puerto Rice with population counts to use in the redrawing of their congressional and state legislative district boundaries. Each state uses these data to redraw boundaries based on its own redistricting standards. Often these boundaries are manipulated (gerrymandering) to favor a political party or class of citizens. Why are race and ethnicity data included in the redistricting data release? Because the Voting Rights Act seeks to ensure that redistricting plans do not discriminate on the basis of race, color, or membership in a protected language minority group.


