
Soon we will be in the midst of our annual snowbird season. How could we have imagined, even a few months ago, that COVID would affect a second tourist season in the valley? The rapid rise of the COVID delta variant has regrettably forestalled our anticipated recovery. With so much changing so quickly, it is difficult to clearly understand how the COVID crisis has affected our local economy.
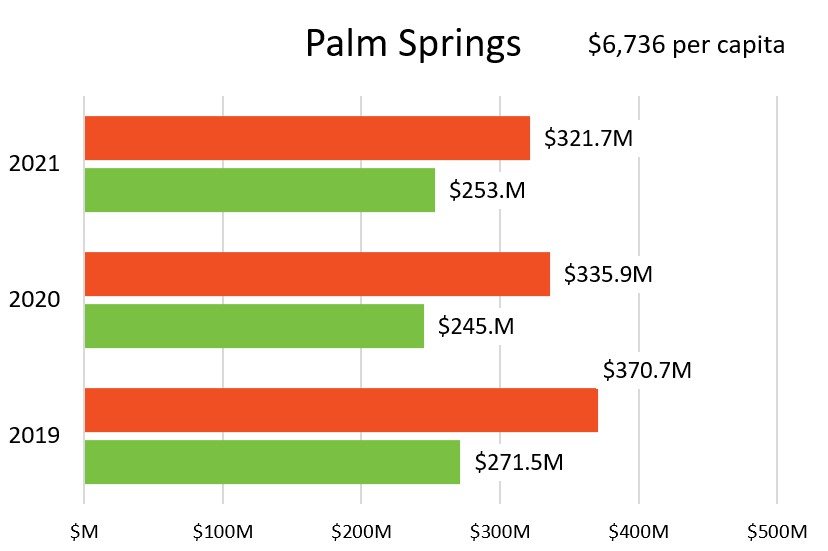
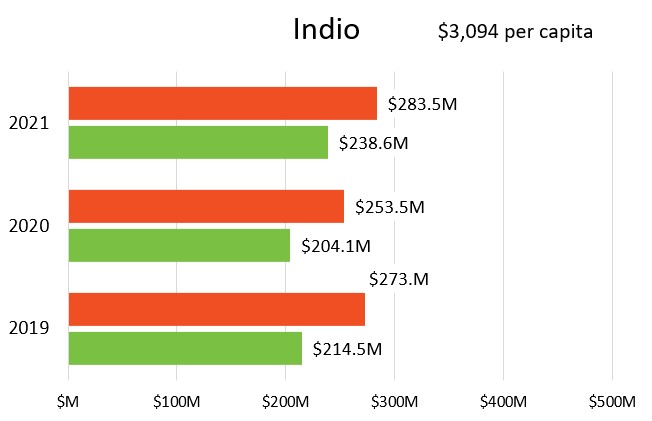
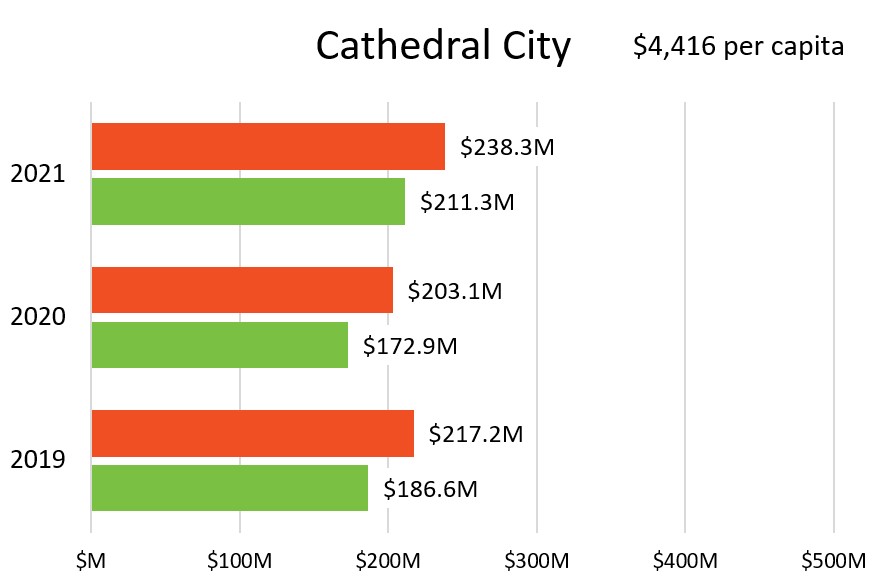
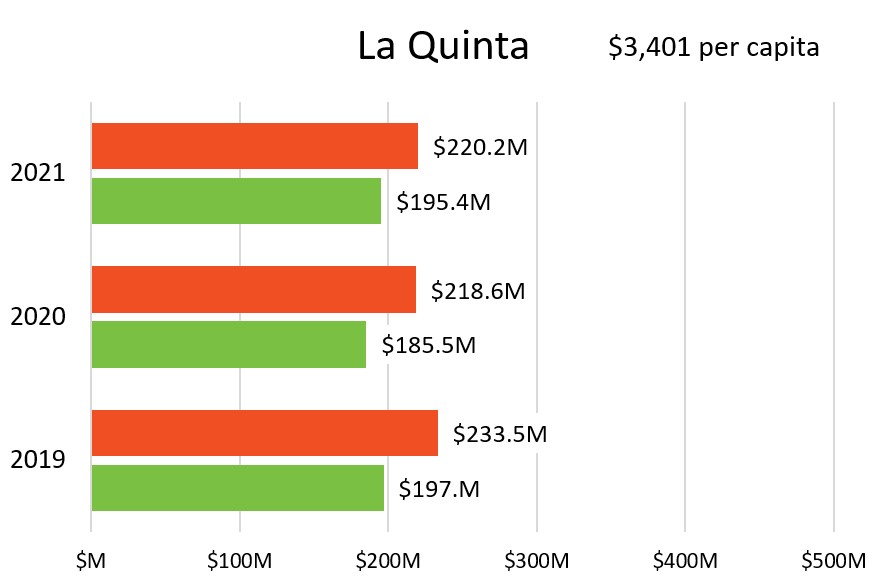
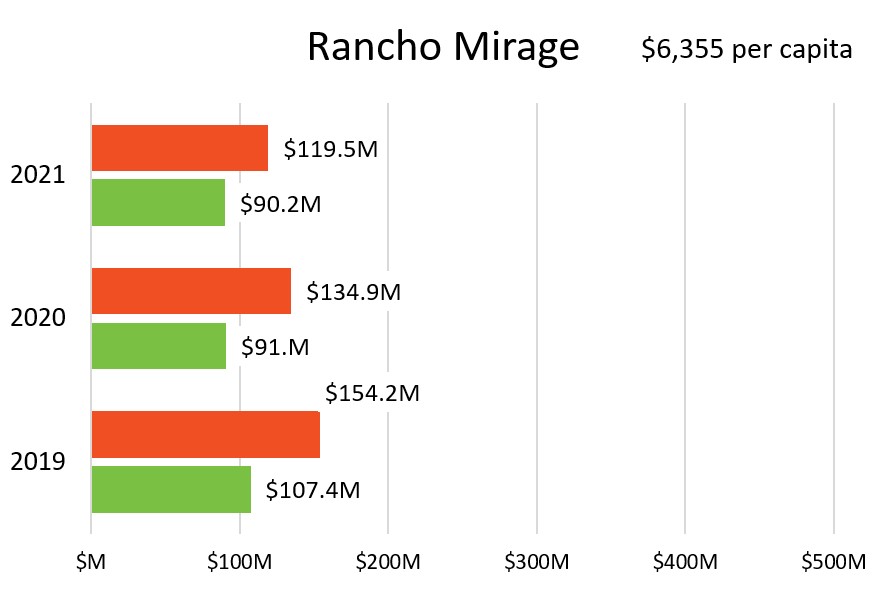
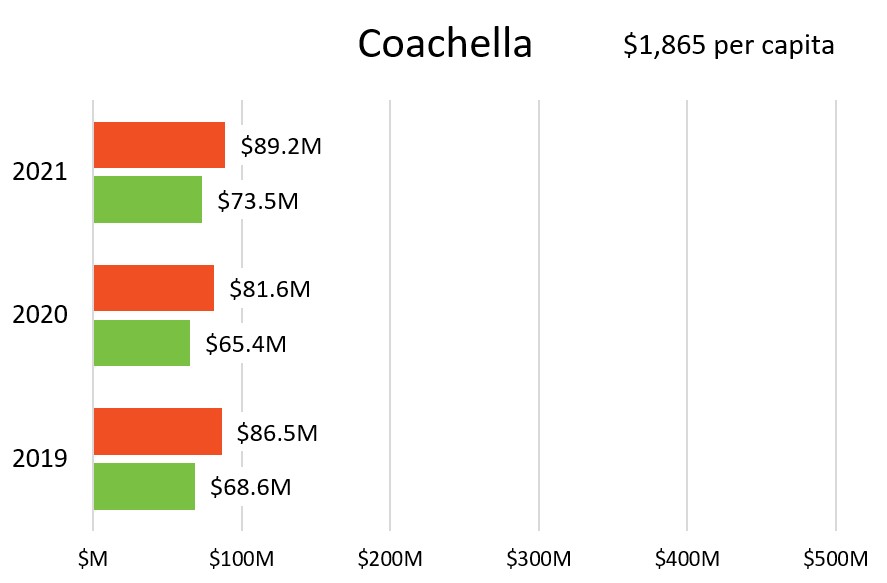
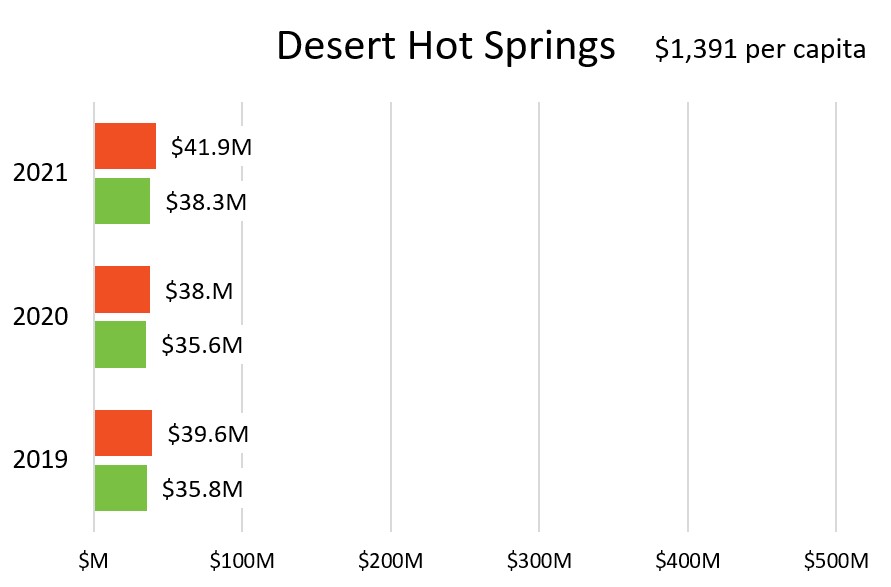
Today we will look at one possible lens: taxable sales. The California Department of Tax and Fee Administration compiles taxable transactions, by city, for each quarter. Transactions that are subject to state sales tax are referred to as “taxable sales.” The tables below show total taxable sales for each city, comparing Quarter 1 (Jan-Mar) for 2019, 2020, and 2021. Retail and Food Services, the largest taxable sector, is shown separately, in addition to total taxable sales.
Comparing our cities using taxable sales is not quite failsafe. Some cities might have proportionately more sales transactions that are taxed by the state, like automobile sales, than others. Still, the data paints a picture of wild swings in growth and decline between cities and years, before and during COVID.

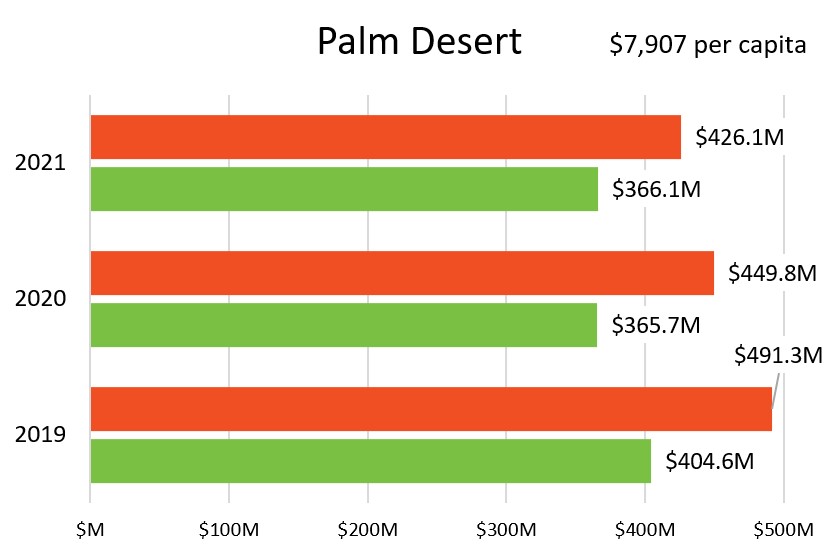
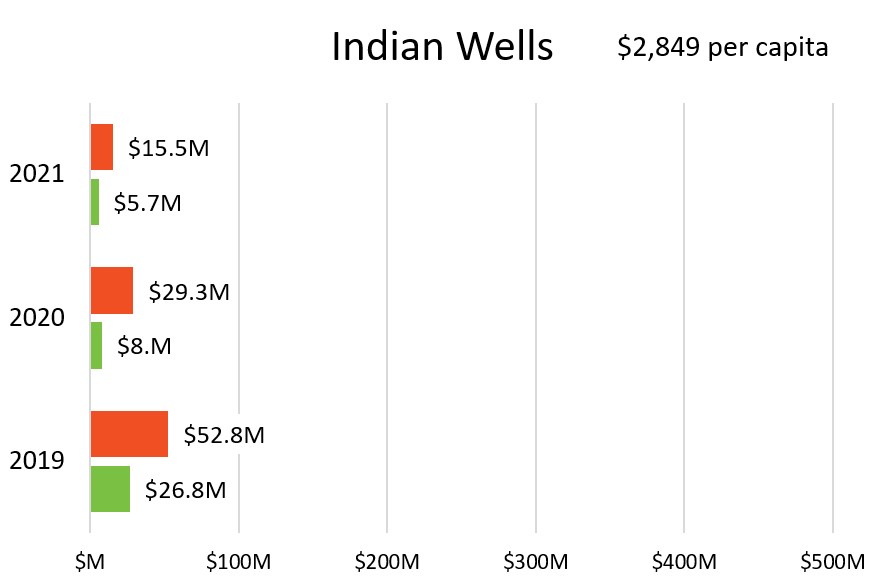
Some statistics immediately stand out. The highest Q1 for retail and food services was in Palm Desert in 2019, $404,580,285. By contrast, the lowest was in Indian Wells in 2021, $5,716,449.
The highest Q1 for all outlets was in Palm Desert in 2019, $491,265,695, while the lowest was in Indian Wells in 2021, $15,463,543. But, if you compare sales per capita, the highest was in Indian Wells in 2019, $9,685. The lowest was in Desert Hot Springs in 2020, $1,281.
If we look at the data by percent change, we see a different picture. The greatest % rise in retail and food Services: 18.2% in Cathedral City, from Q1 2020 to Q1 2021. The biggest drop was -368.9% in Indian Wells from Q1 2019 to Q1 2021.
For all outlets’ taxable sales, the greatest % rise was again in Cathedral City: 14.8% from Q1 2020 to Q1 2021. The biggest drop was again in Indian Wells, -241.4% from Q1 2019 to Q1 2021.
Source: California Department of Tax and Fee Administration


