

You can’t seem to open a newspaper or listen to the news lately without hearing a story about employers having a hard time finding new employees. Despite a resurging economy and countless job openings, many openings remain unfilled. In fact, the New York Times reports that there are more job openings this spring than before the pandemic. But there are far fewer people in the labor force – millions less. The pandemic seems to have made a lot of people question work and its role in their lives.
The Times reports that a record 4 million American workers quit their jobs in April, or 2.7% of the US workforce. The hardest-hit sector for quitting? Leisure and Hospitality. In April, 740,000 of these workers quit their jobs, 5.3% of them in accommodation and foodservice.
There are many arguments about why people are quitting or not returning to the workforce. Some claim that the pandemic jobless benefits, set to expire in September, disincentivize people to work. Others argue that difficulties in finding child or elder care are keeping people from working. Some are waiting for higher wages in this unusual employee-led job market. Many people are still afraid to go back to work during an ongoing pandemic. During the lockdown, some workers were able to save which allows them the flexibility to look for new, better work. And some, being required to return to work in an office or workplace, want to keep the flexibility of working from home and are not returning to such employment.
Regardless of the reasons, a lack of workers is causing low-wage earnings to rise. The Wall Street Journal reports that Leisure and Hospitality wages, a predominant sector in our local economy, were up 10.4% in May from February of 2020. Pay for workers with high school diplomas is rising faster than wages for college grads. These changes have great repercussions for our local workforce and employers. Will these be permanent changes?
Today’s map shows the distribution of our working-age population (ages 16-64) in the Coachella Valley. Green areas represent census block groups with the lowest concentration of this population, while orange areas represent the highest concentrations. While distributed throughout the valley, high concentrations of workers are most represented in the east and northern parts of the valley.
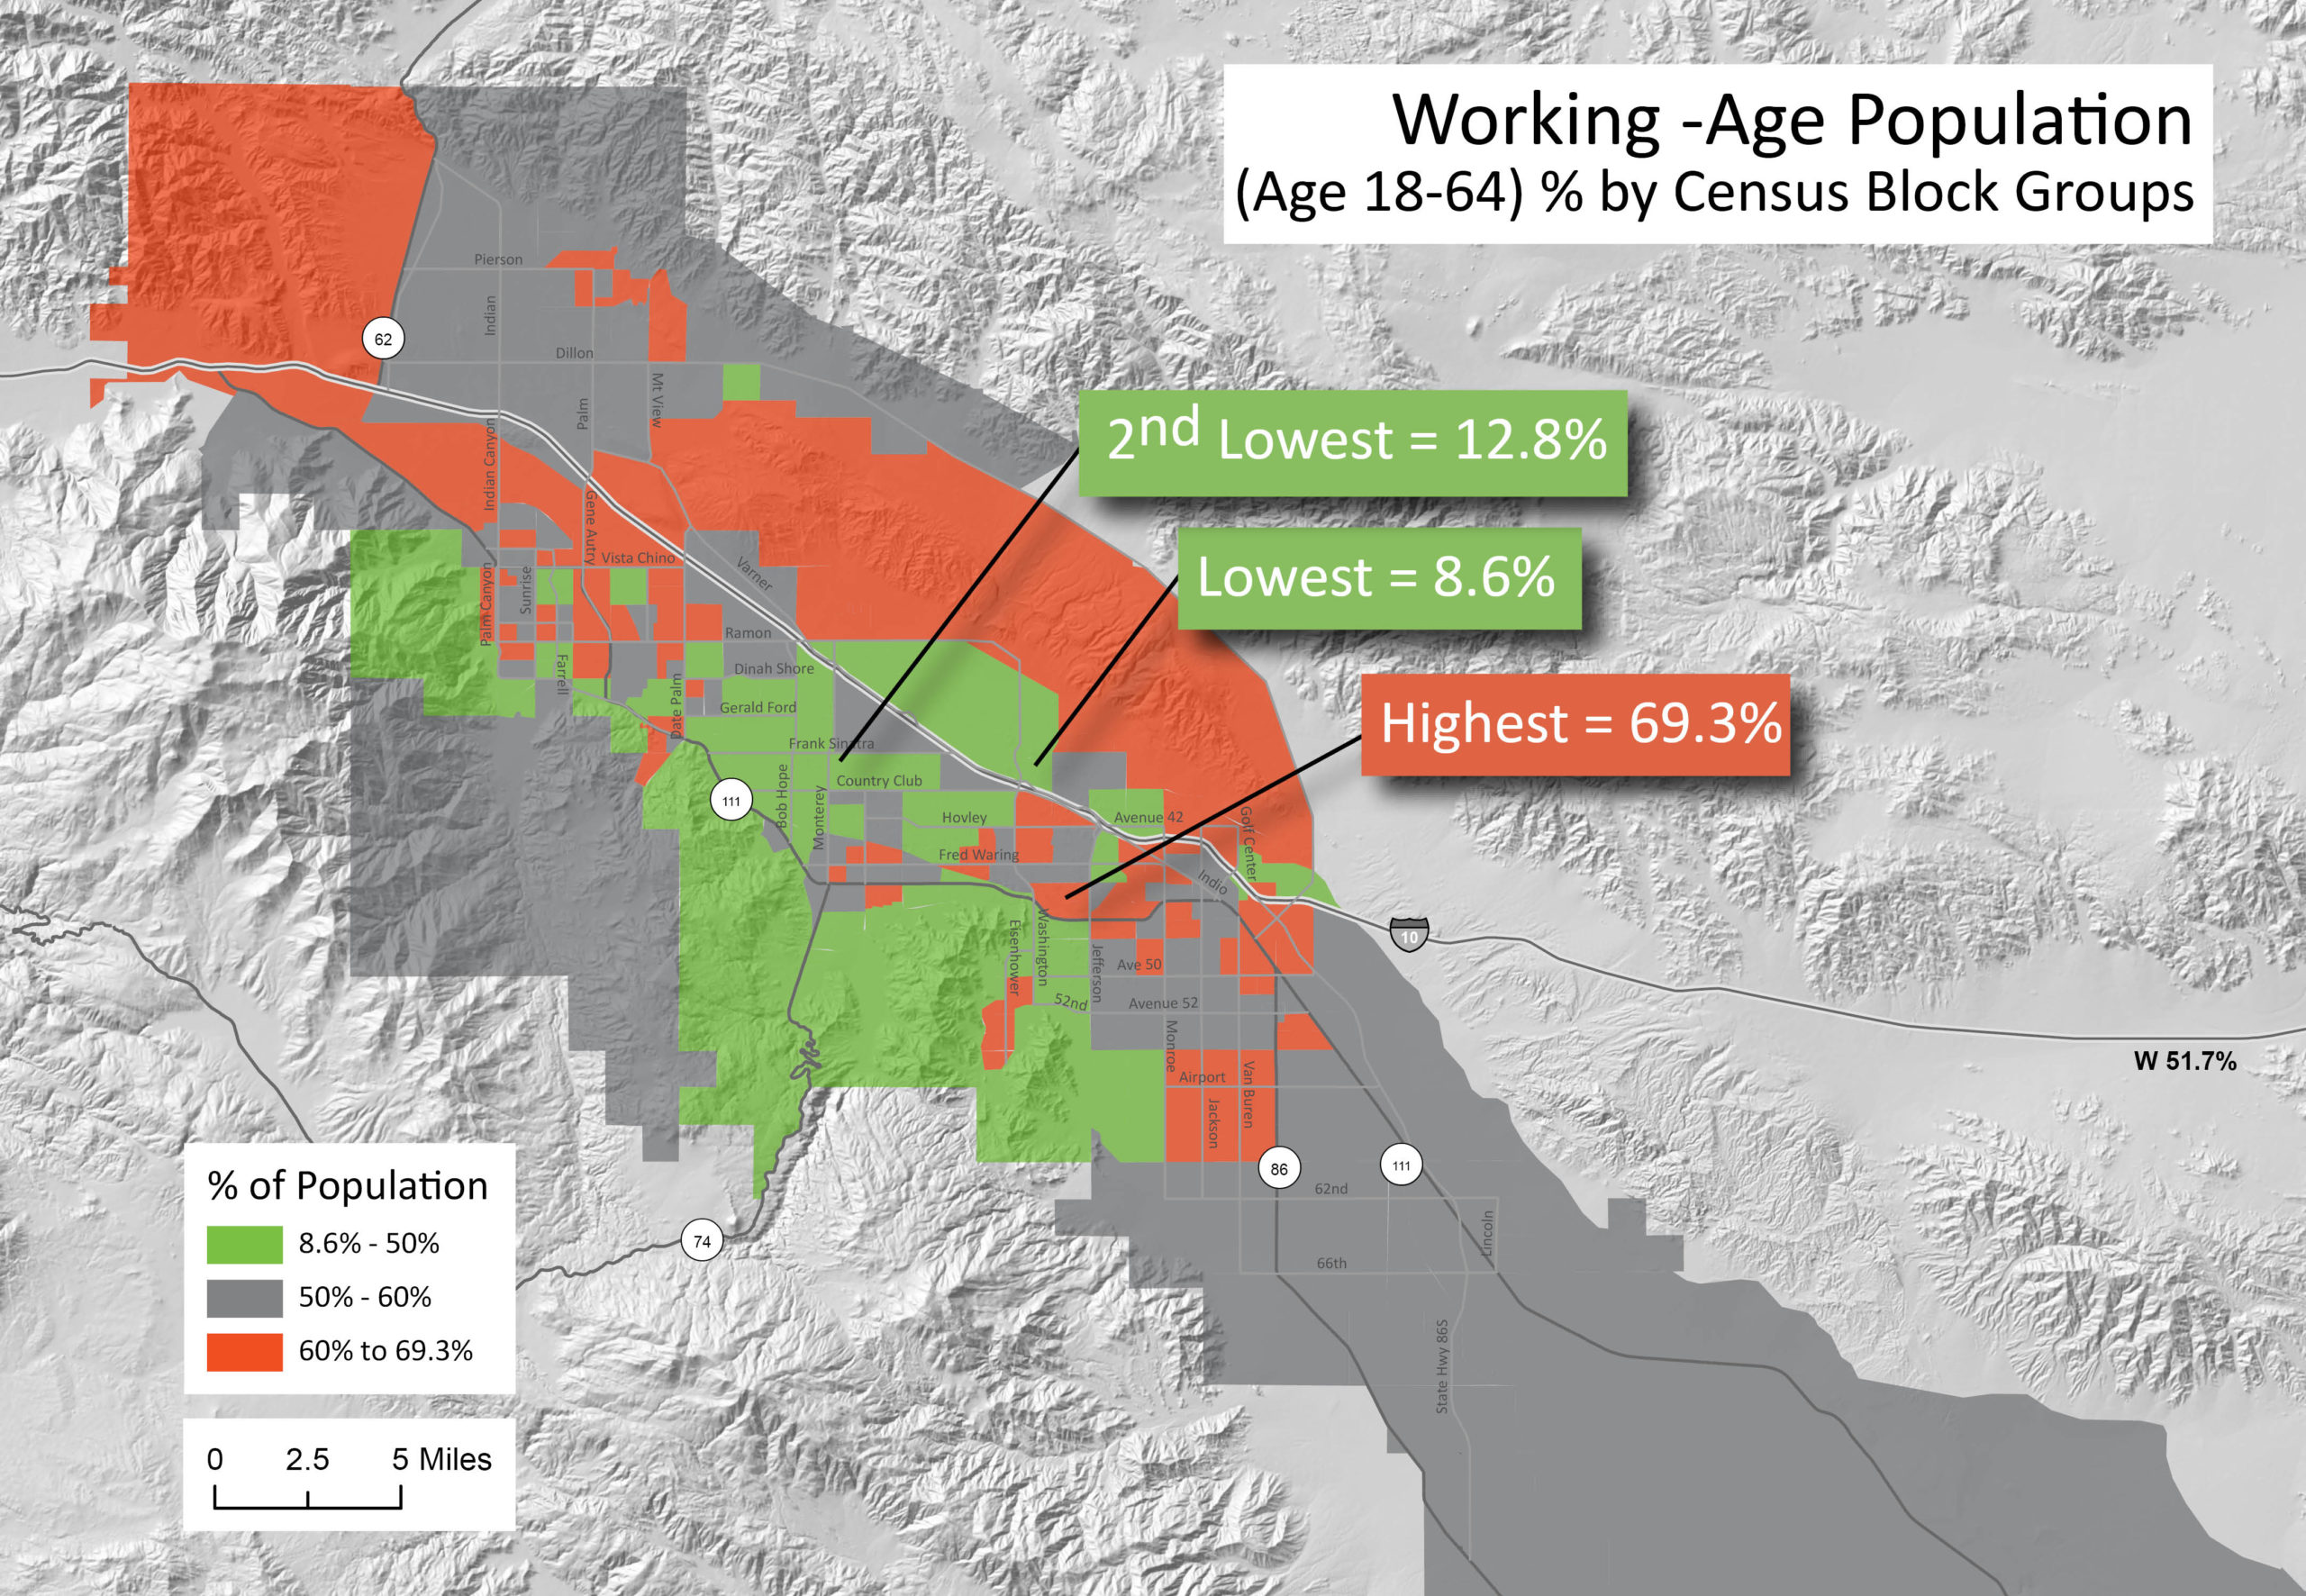
Looking at this distribution brings up many policy questions. Do our workers live close enough to their work? Does our transportation network adequately serve this distribution? The working-age population is also the population with children. Are our schools properly dispersed and allocated? Do we have adequate affordable housing for this population, or is the affordable housing away from their employment?
Source: Esri Business Analyst, Wall Street Journal, New York Times


