
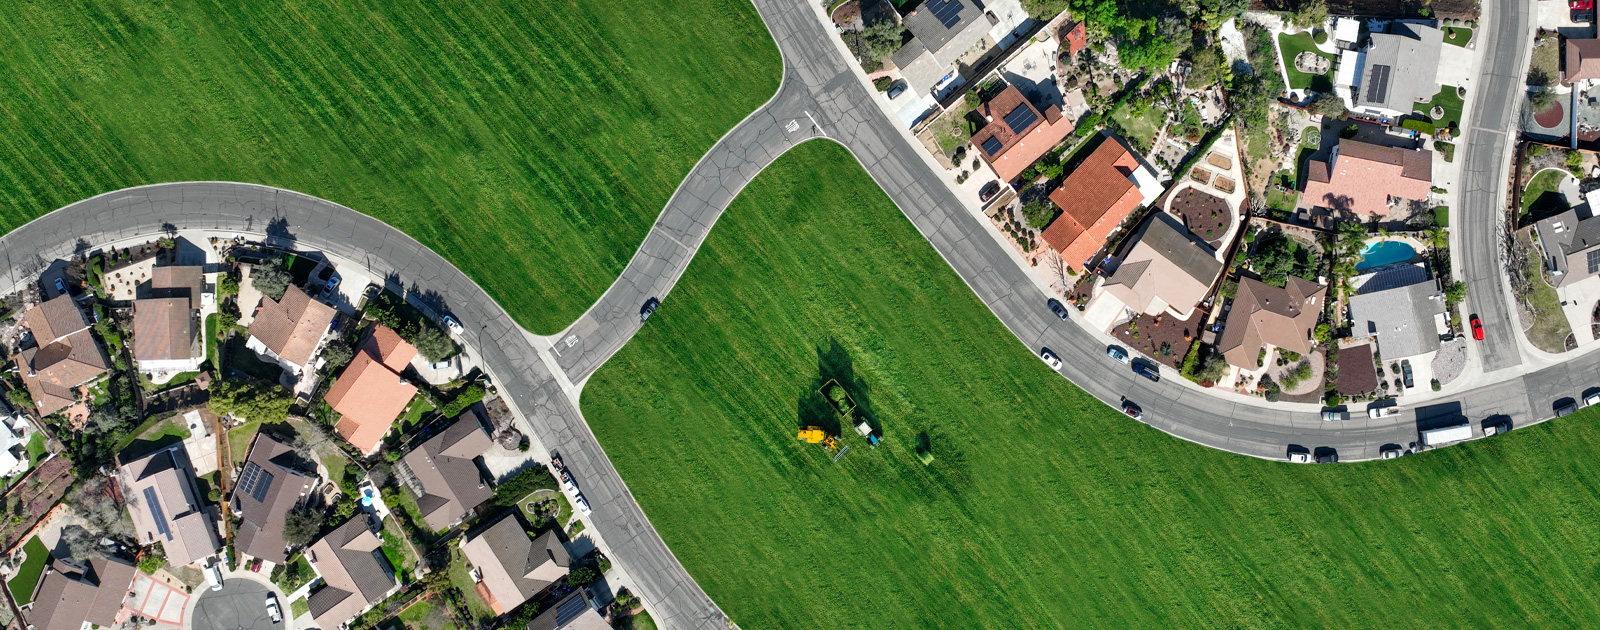
The Coachella Valley Agriculture sector is valued at an estimated $600 million, according to the 2019 Coachella Valley Water District’s (CVWD) 2019 Crop Report. It accounts for half the estimated $1.3 billion agriculture industry in Riverside County. By CVWD’s estimations, agriculture is the “second largest contributor to the local economy,” They estimate it contributes nearly $1 billion to the local economy and creates approximately 12,000 jobs. Today’s Data Digest surveys agriculture in the valley mapping the approximate 41,000 acres under cultivation. We look at what is grown here and how much cropland we have lost since 1990.
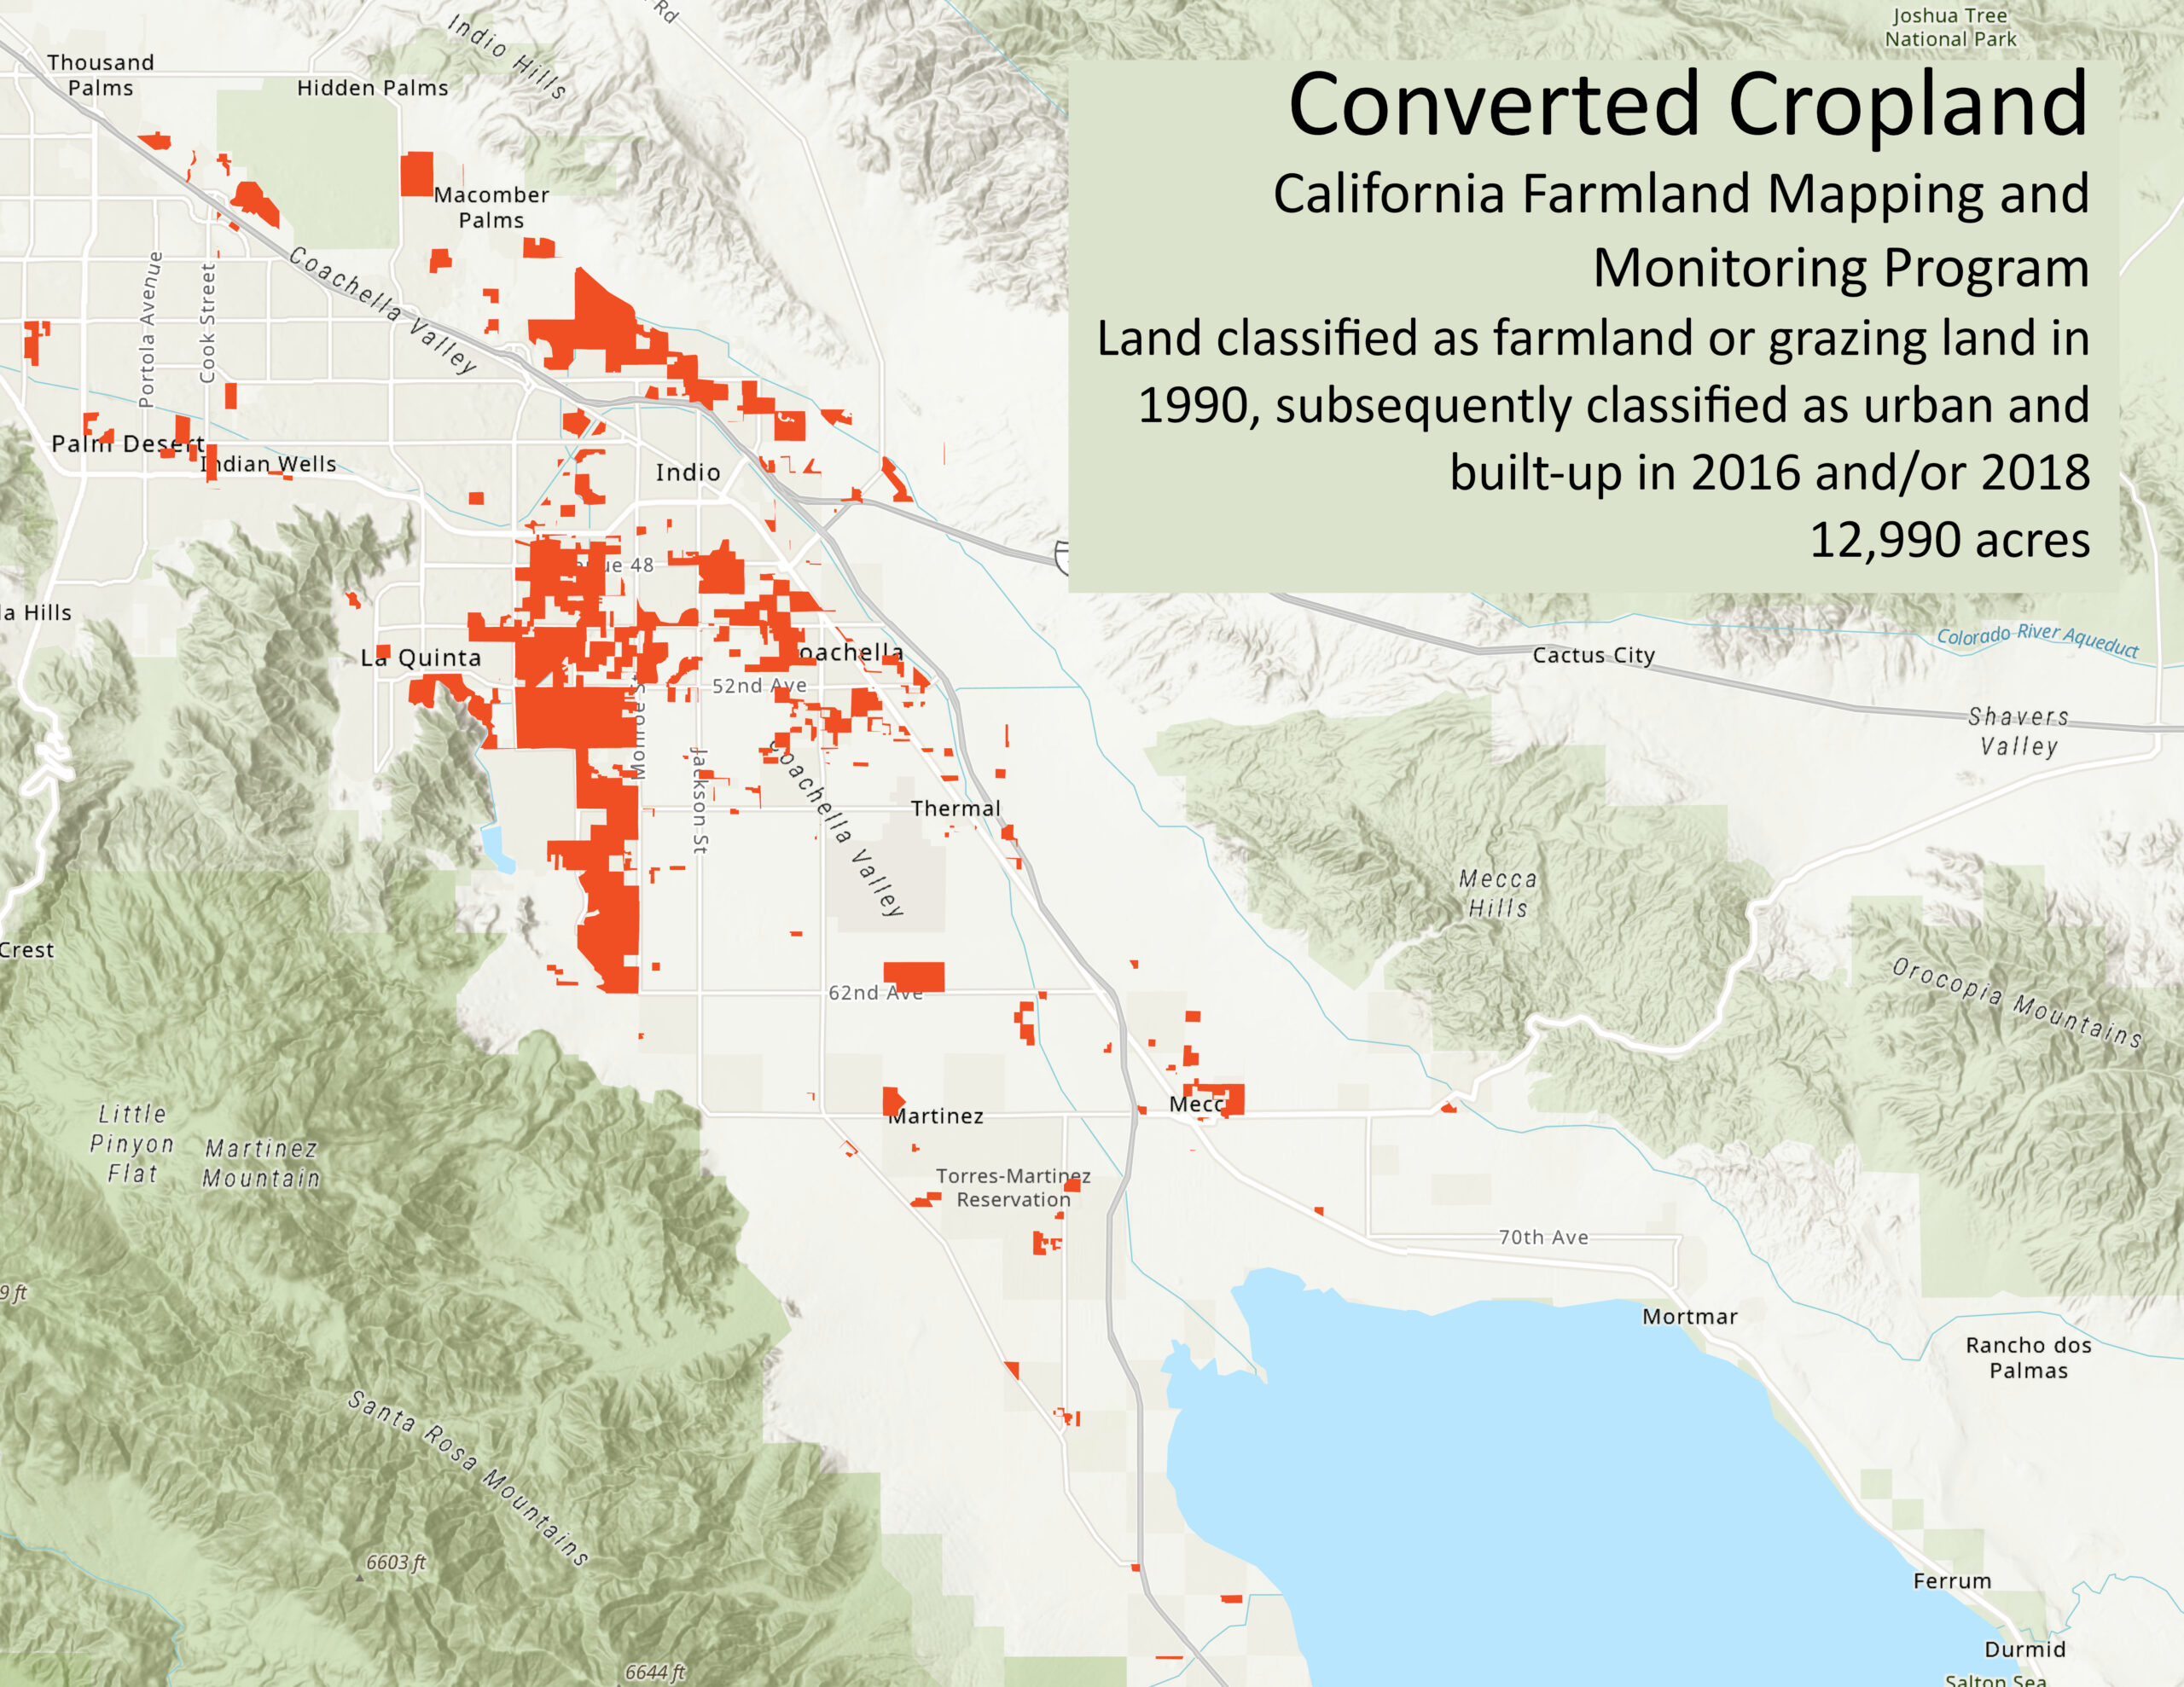
This map displays the results of the California Farmland Mapping & Monitoring Program from the California Department of Conservation. The dark orange polygons represent parcels that were farmland or grazing land that have subsequently been classified as urban or built-up areas by 2016 or 2018. Nearly 13,000 acres of farmland have been lost since 1990. By comparison, nearly the same amount of land was used to cultivate vegetables in 2016.
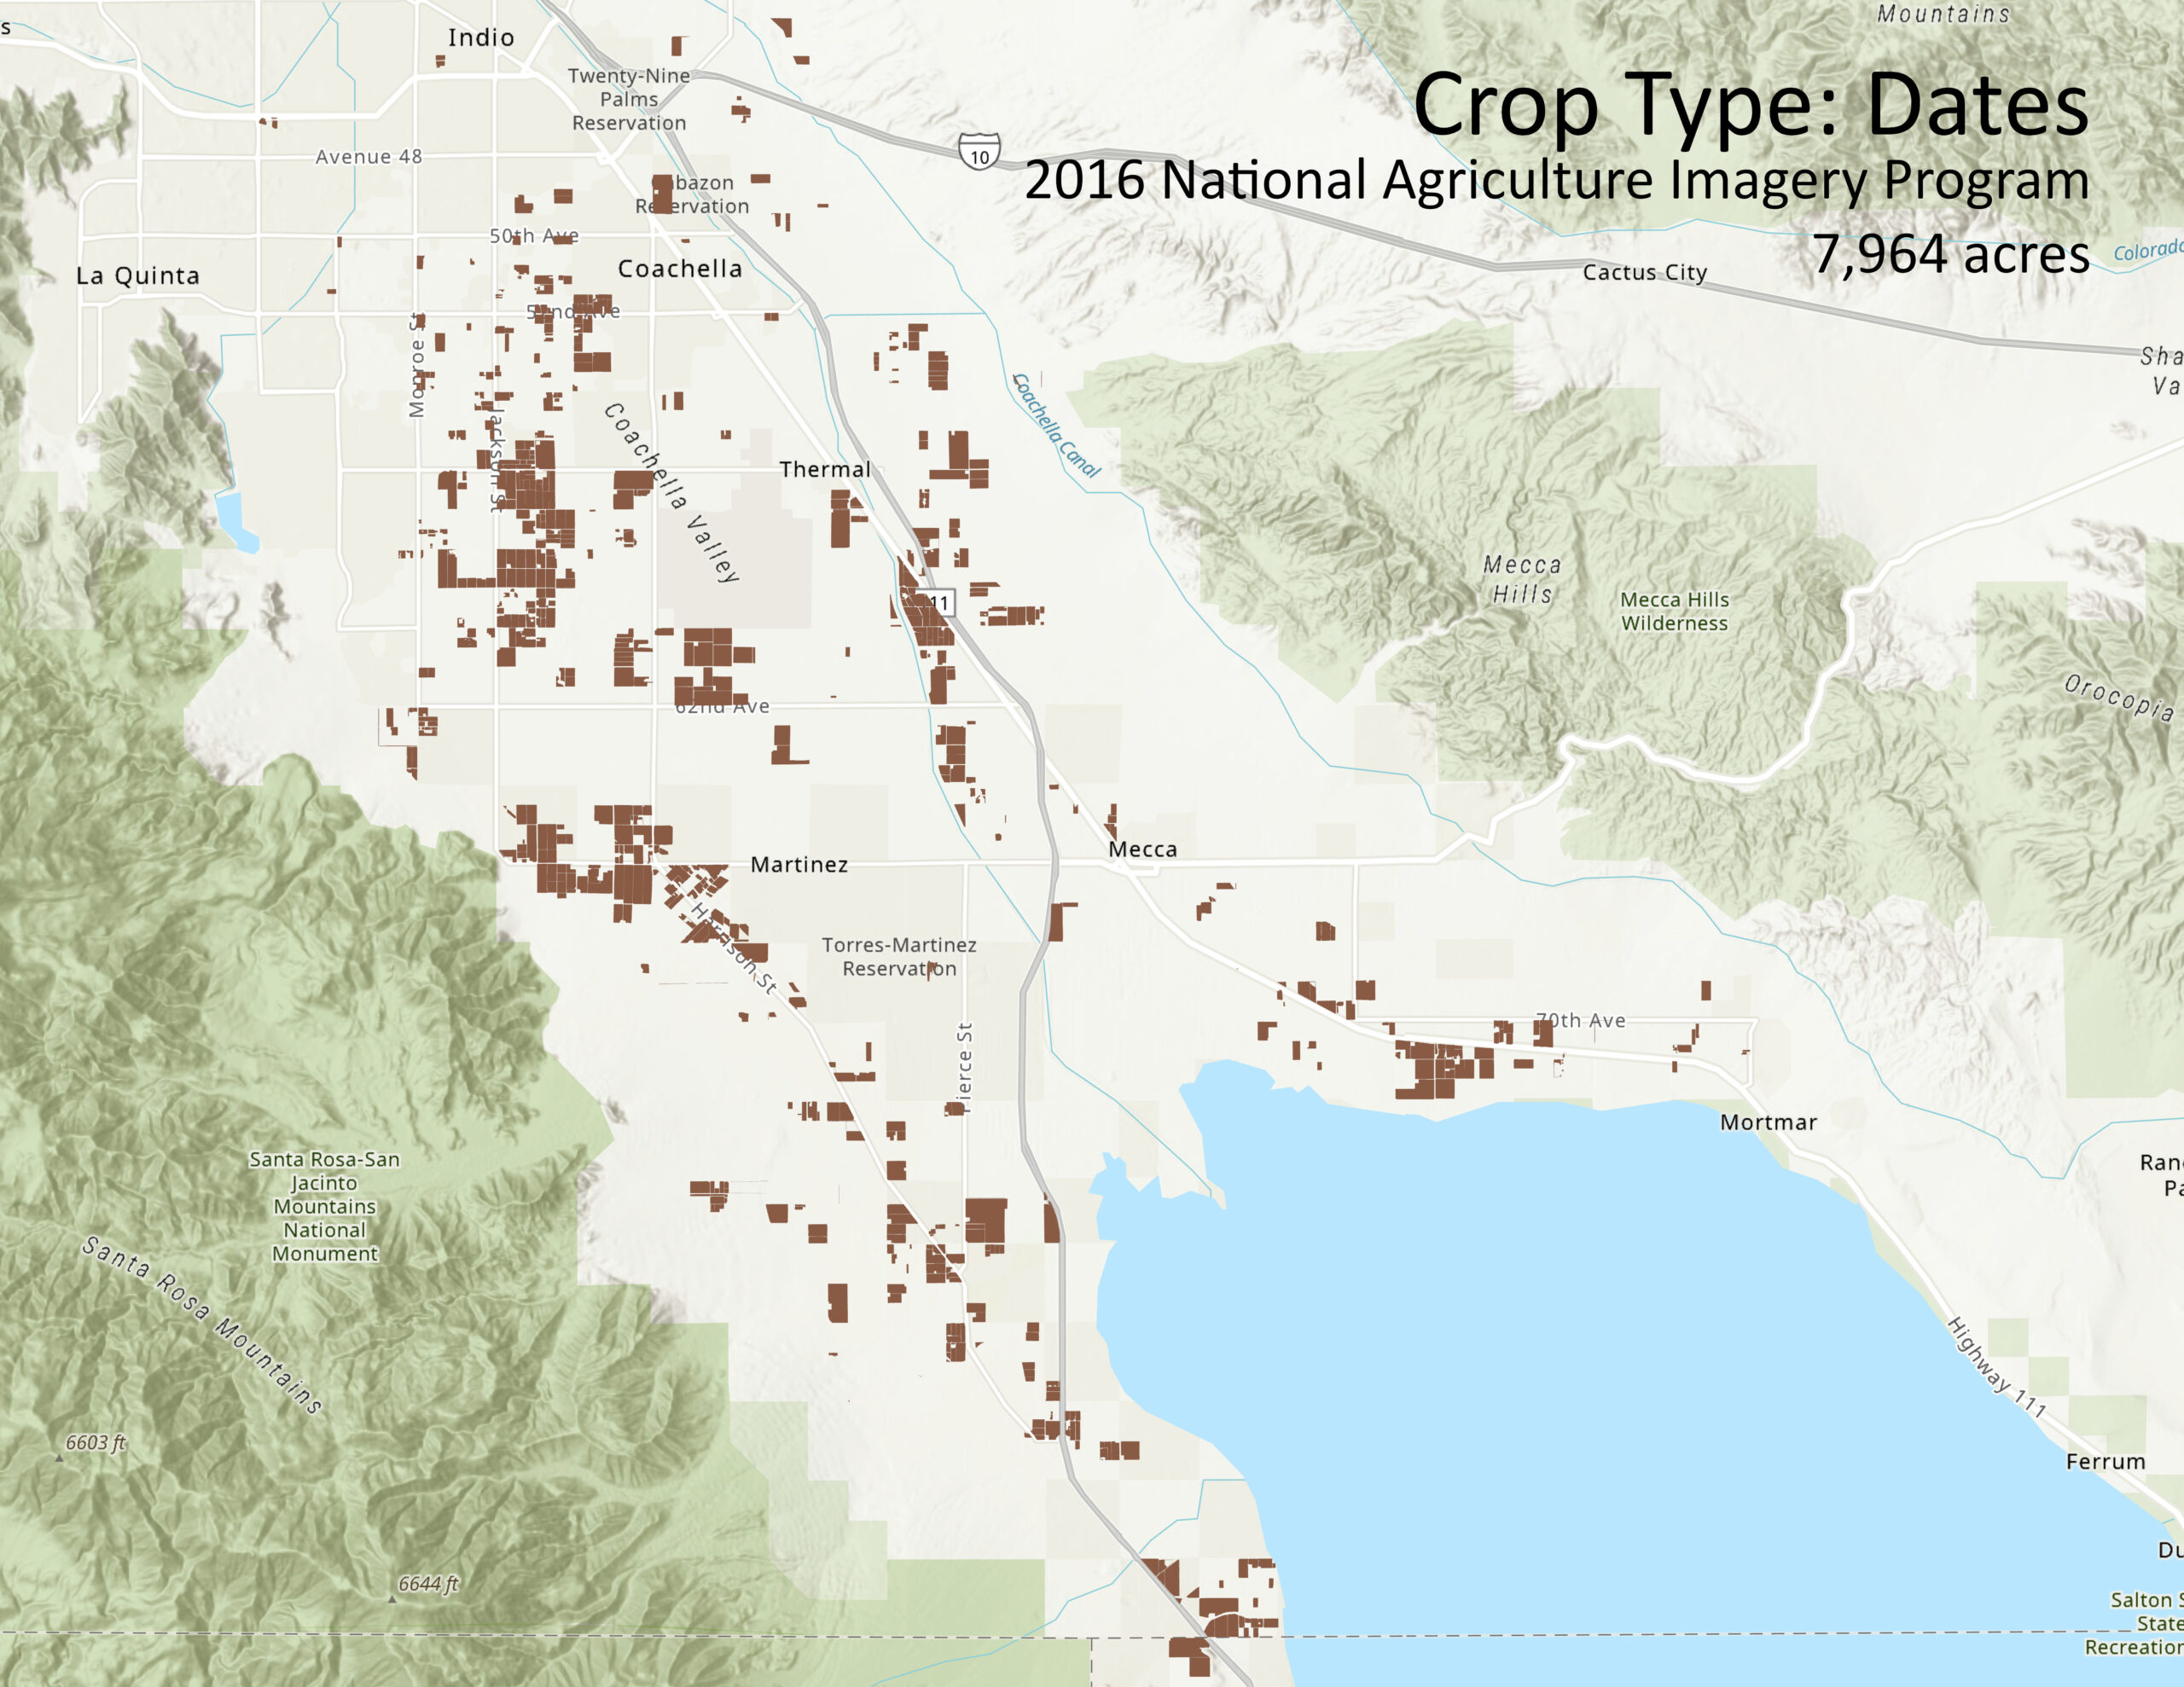
The largest acreage of agriculture cultivation in the Coachella Valley is dates. According to the CVWD 2019 crop report, dates had the highest annual value of $94 million, or 15.7% of all agriculture production. From 2015 to 2019, date production nearly doubled while many other important crops have seen production declines.
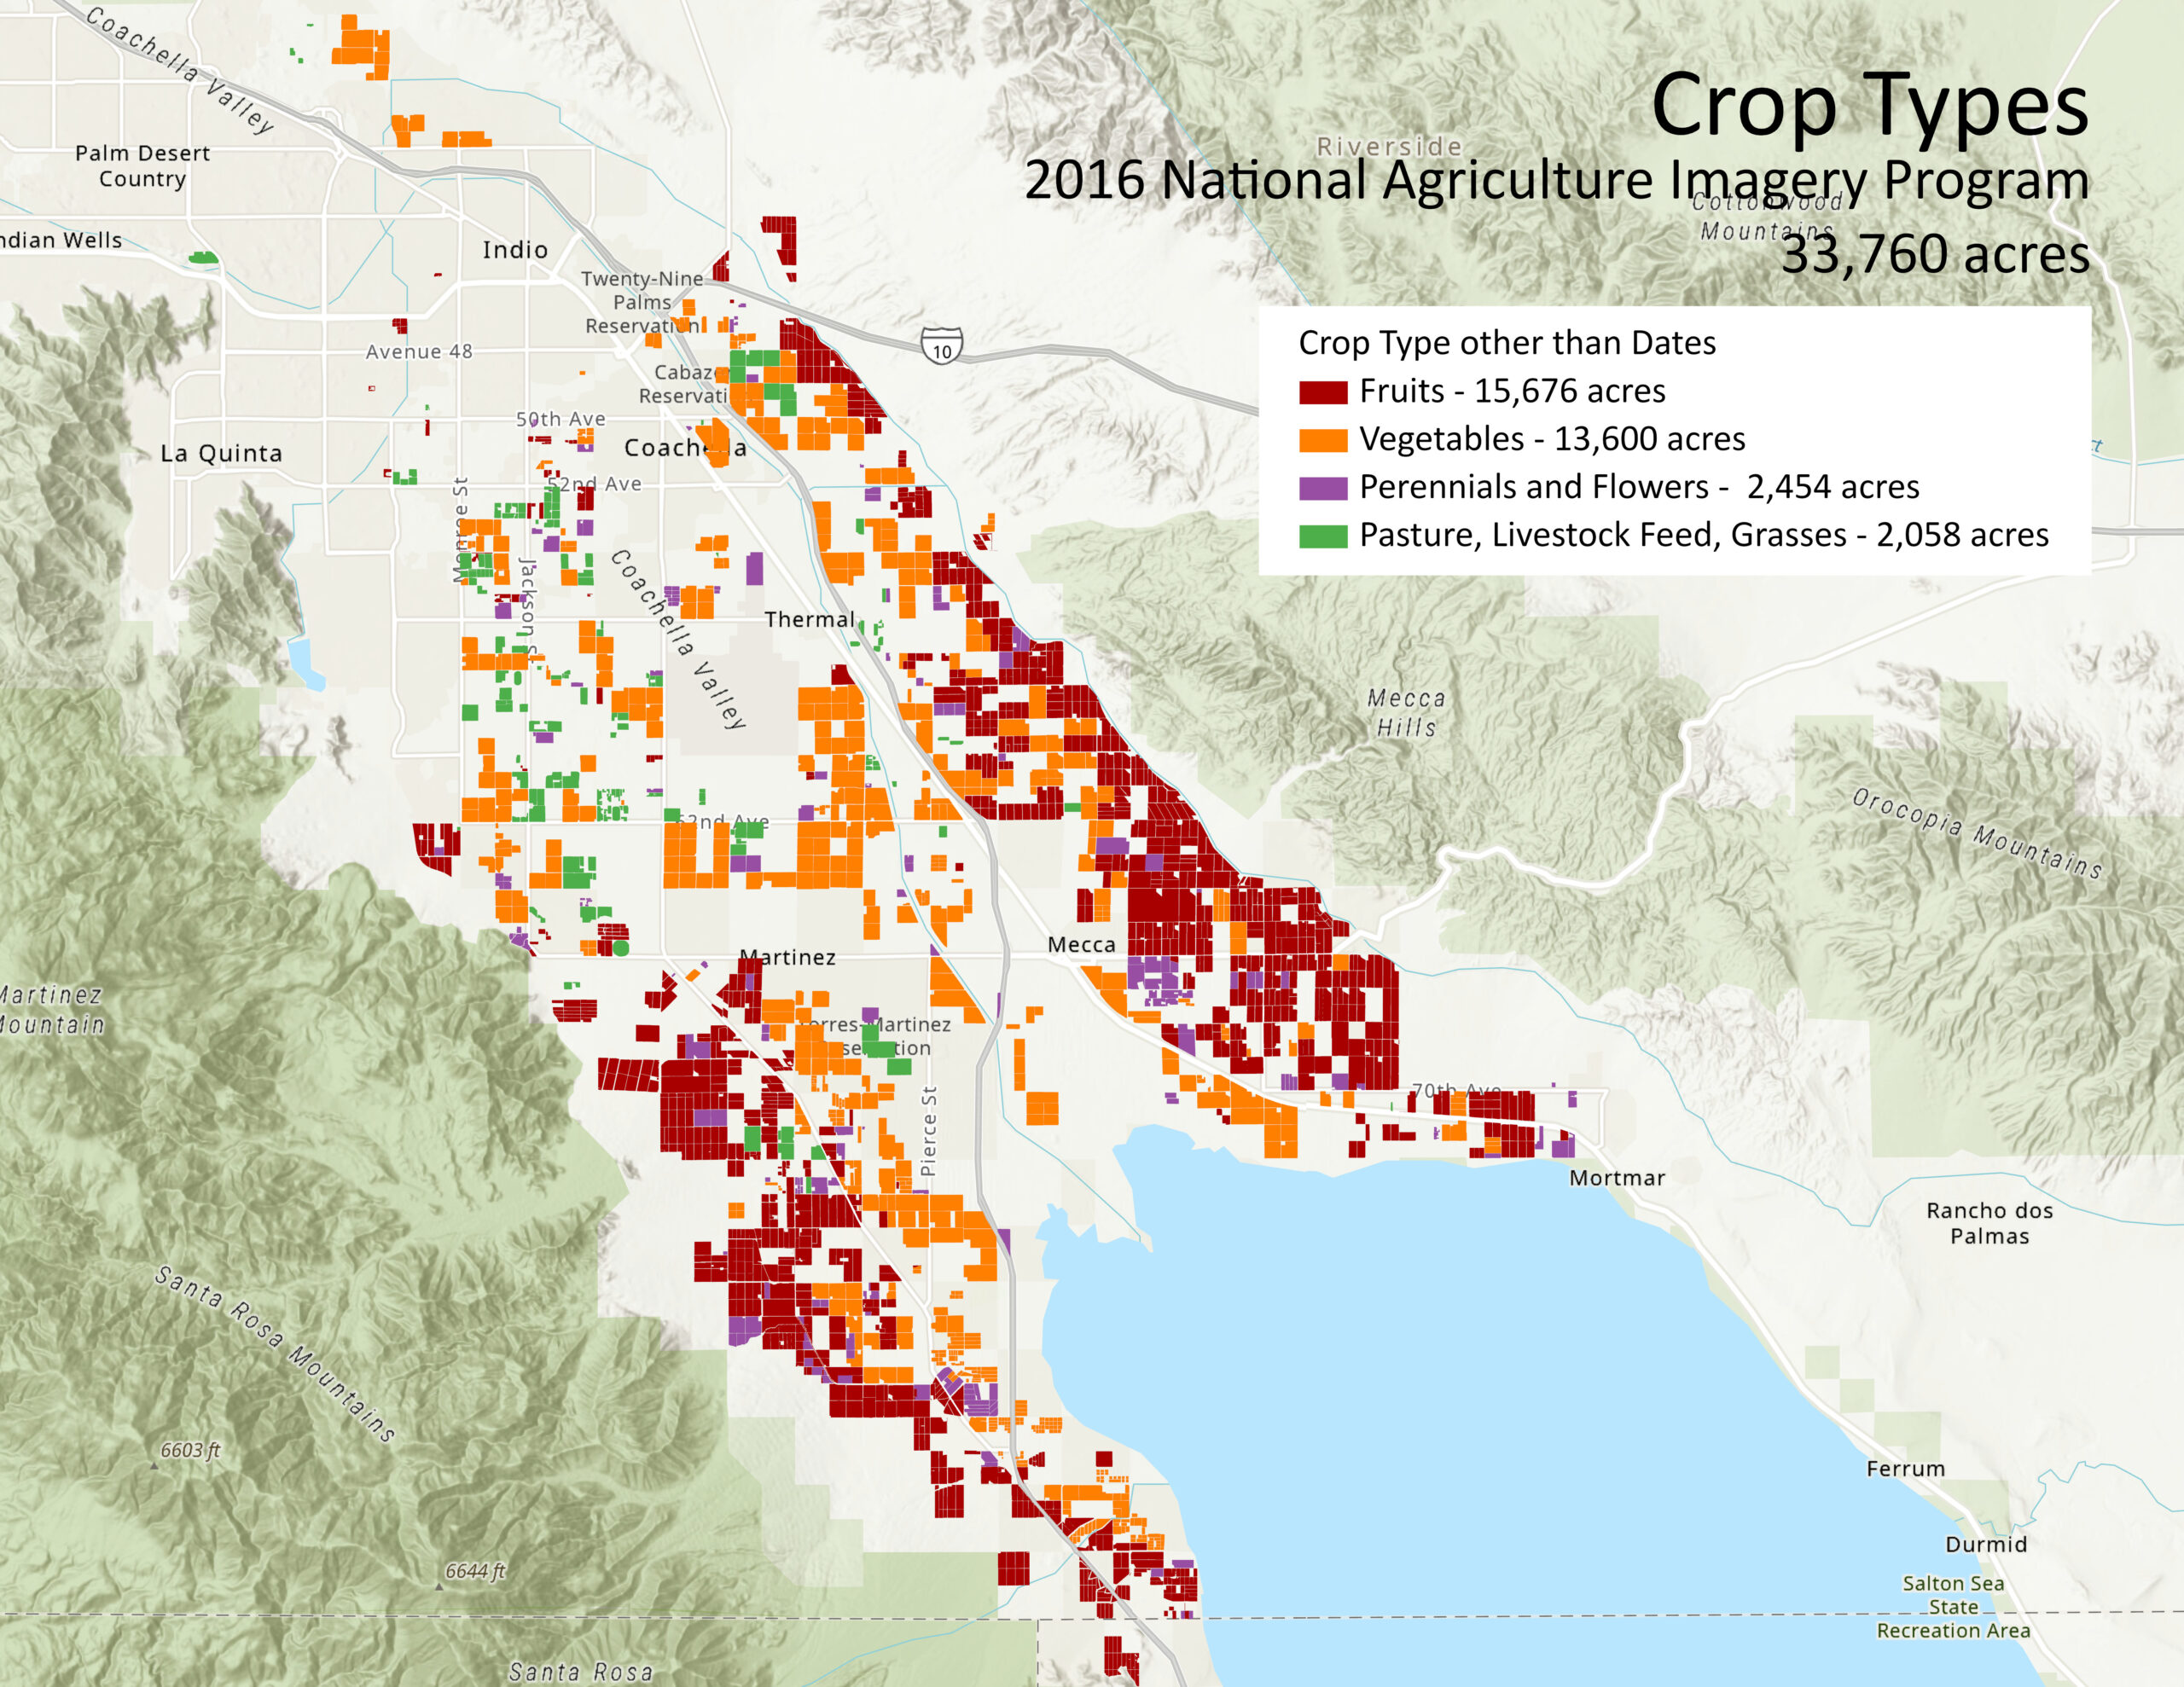
This map shows the approximate distribution of other agricultural crops in 2016. The top fruit crops include grapes (15.5% of all agricultural production), lemons and limes (6.1%), and oranges-tangerines (2.9%). The top vegetable crops include bell peppers (11.8%), carrots (5.2%), lettuce (5.2%), and Asian vegetables (2.3%). The cultivation of golf course turf is the fourth highest commodity at 9.3%.


