

As we prepare for our annual Economic Summit this November, we are starting to dig through lots of interesting demographic, economic, and business data. Today we present data about the total number of businesses by sector categorized by the federal government’s North American Industry Classification System (NAICS). Over the next few weeks, we will preview data about business establishments in the Coachella Valley. We’ll show a ranking by sector for the valley, and how that compares with Riverside County, California, and the entire U.S. In later Data Digests, we will look at ranks based on the number of employees and annual earnings.
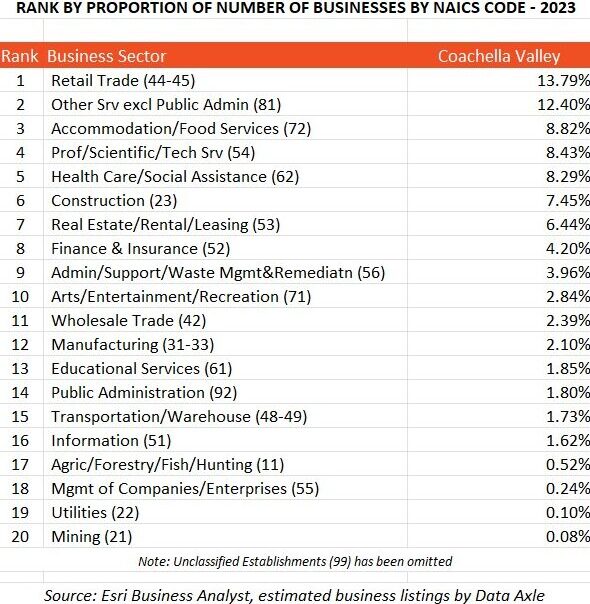
This table shows the ranking from 1 – 20 of the major NAICS industry sectors. The ranking is based on the proportion of total number of businesses. We have omitted NAICS 99 – Unclassified Establishments, so the percentage column will not add up to 100%.

This table compares business proportions in the Coachella Valley with Riverside County, California, and the U.S. In every case, the predominant sector is Retail Trade, the sector on which our national economy most relies. The second highest sector in all cases is Other Services. This includes establishments like hair salons, pet care, and dry cleaning. Where the valley differs is in the third highest sector – Accommodation/Food Services. Our proportion is over 1% higher than in the other geographies due to our extensive hospitality and tourism economy.
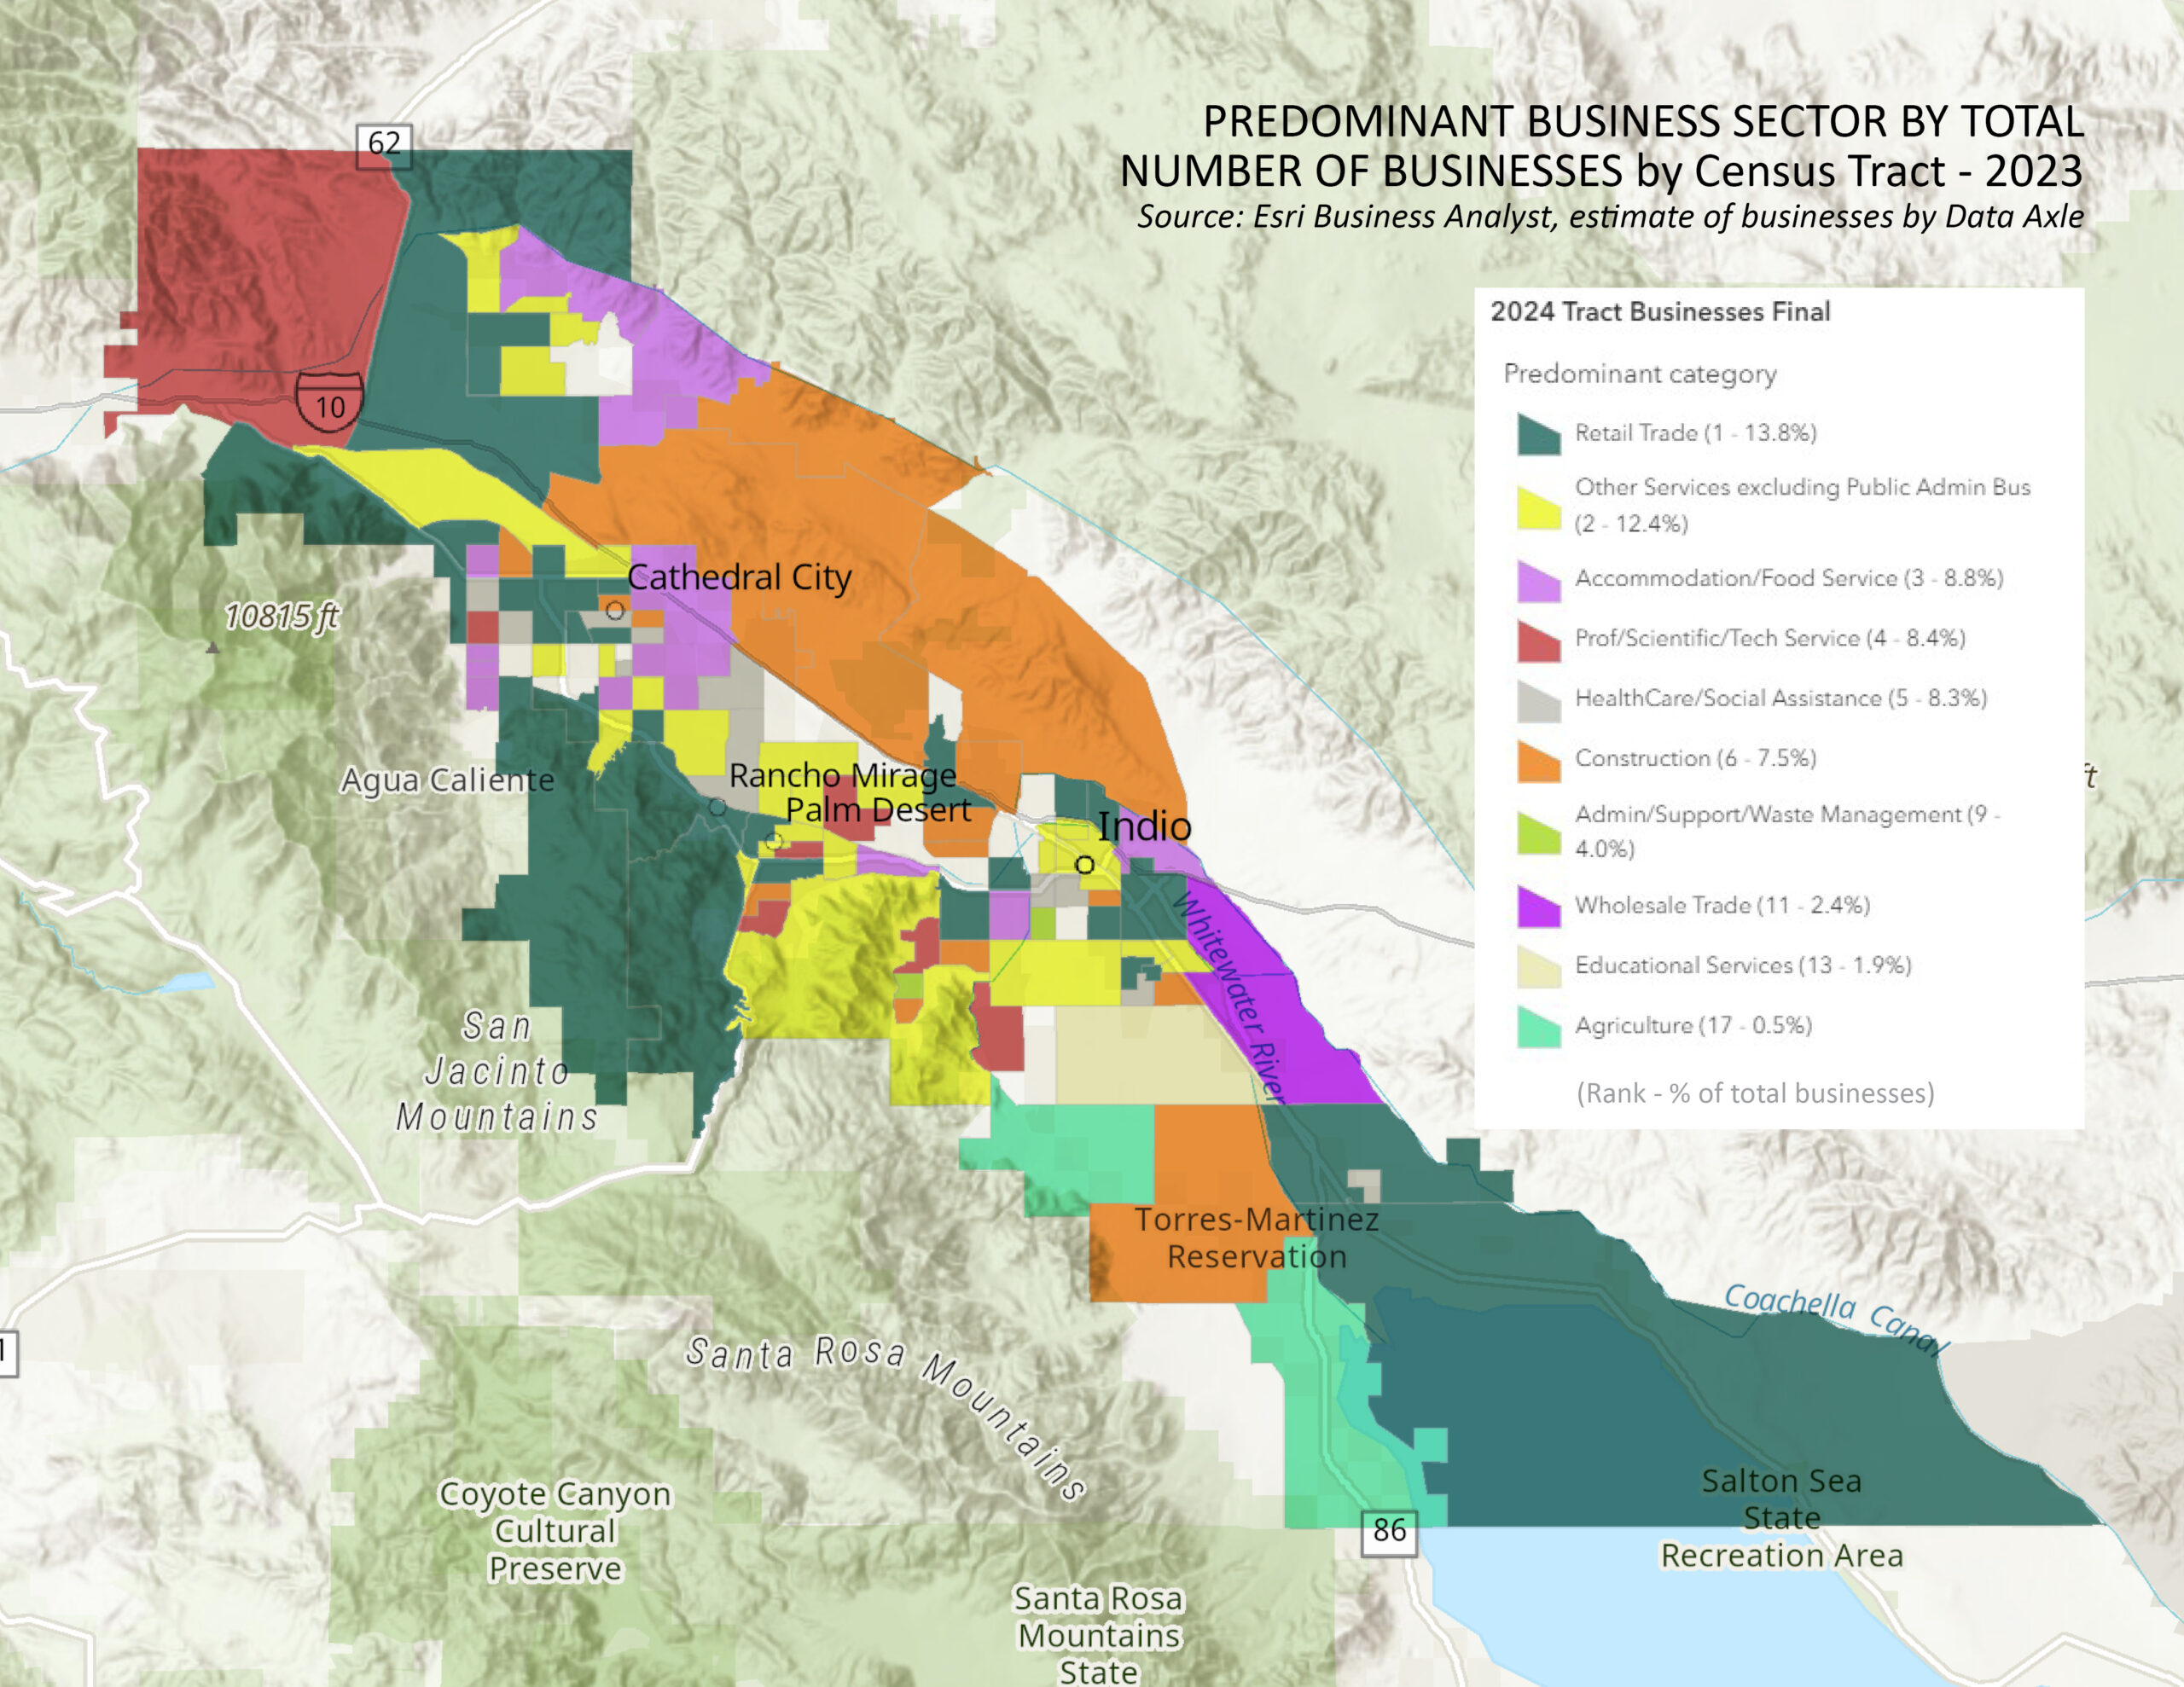
This map displays, by census tract, the predominant business sector by total number of businesses. The legend shows the sectors ranked in order of predominance, like in the first table above. Note that some ranks are missing, like #7 and #8. They may rank overall for the entire valley, but for each census tract, they may never represent the most predominant sector.


