

No more Summit Report sneak peeks. I’m thrilled to announce that the official Economic Report for 2023 is now available for download on our website. We are excited to share with you nearly 75 pages of comprehensive business and socioeconomic data about the Coachella Valley. Enjoy our economist Dr. Manfred Keil’s “big picture” discussion, COVID-19 Economic Expansion Finishing with Hard or Soft Landing in 2024, a thorough overview of our local economy heading into 2024. This is followed by 7 sections of tables and graphs: Demographics, Income, Employment, Taxable Sales, Education, Transportation, and Crime Rates. Today we will concentrate on one of the 55 figures in the report – Figure 15: Diversity Index, Coachella Valley Cities, 2023.
I did not choose Figure 15 to discuss diversity and equity in our valley. Instead, I wanted to make a case for how we obtain much of our data here at CVEP and how we might help you access hard-to-find, detailed data at a much finer scale than even the city or zip code level. We use Esri Geographic Information System (GIS) datasets because they can often be aggregated to very small areas, sometimes down to the neighborhood level. And for a place like the Coachella Valley that has so many geographic entities – tribal lands, water districts, congressional districts, etc., such aggregation can make the difference between merely adequate “close enough” data and demonstrably persuasive localized information.
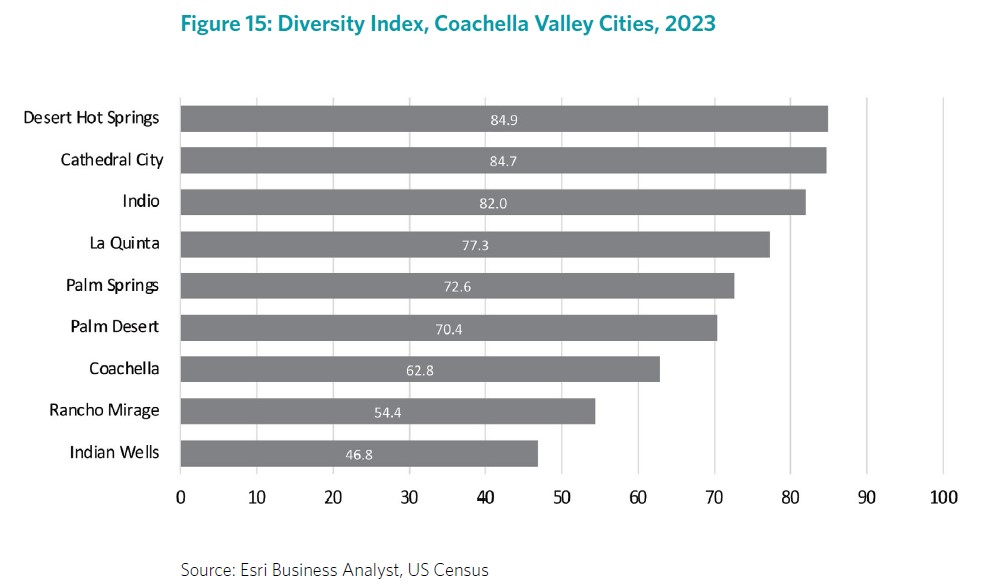
Esri uses statistical updates of the 2020 Census data for race and ethnicity to create their Diversity Index. The index is simply the probability that 2 people living near one another will belong to a different race or ethnicity. Figure 15 displays the Index for the nine cities of the Valley. And, like all things Coachella Valley, we have quite a range of index values – a very diverse Diversity Index. In Desert Hot Springs, you are 40% more likely to live near someone of a different race or ethnicity than if you lived in Indian Wells. But those indices are only averages for a whole city. What does the index look like at a more micro level?
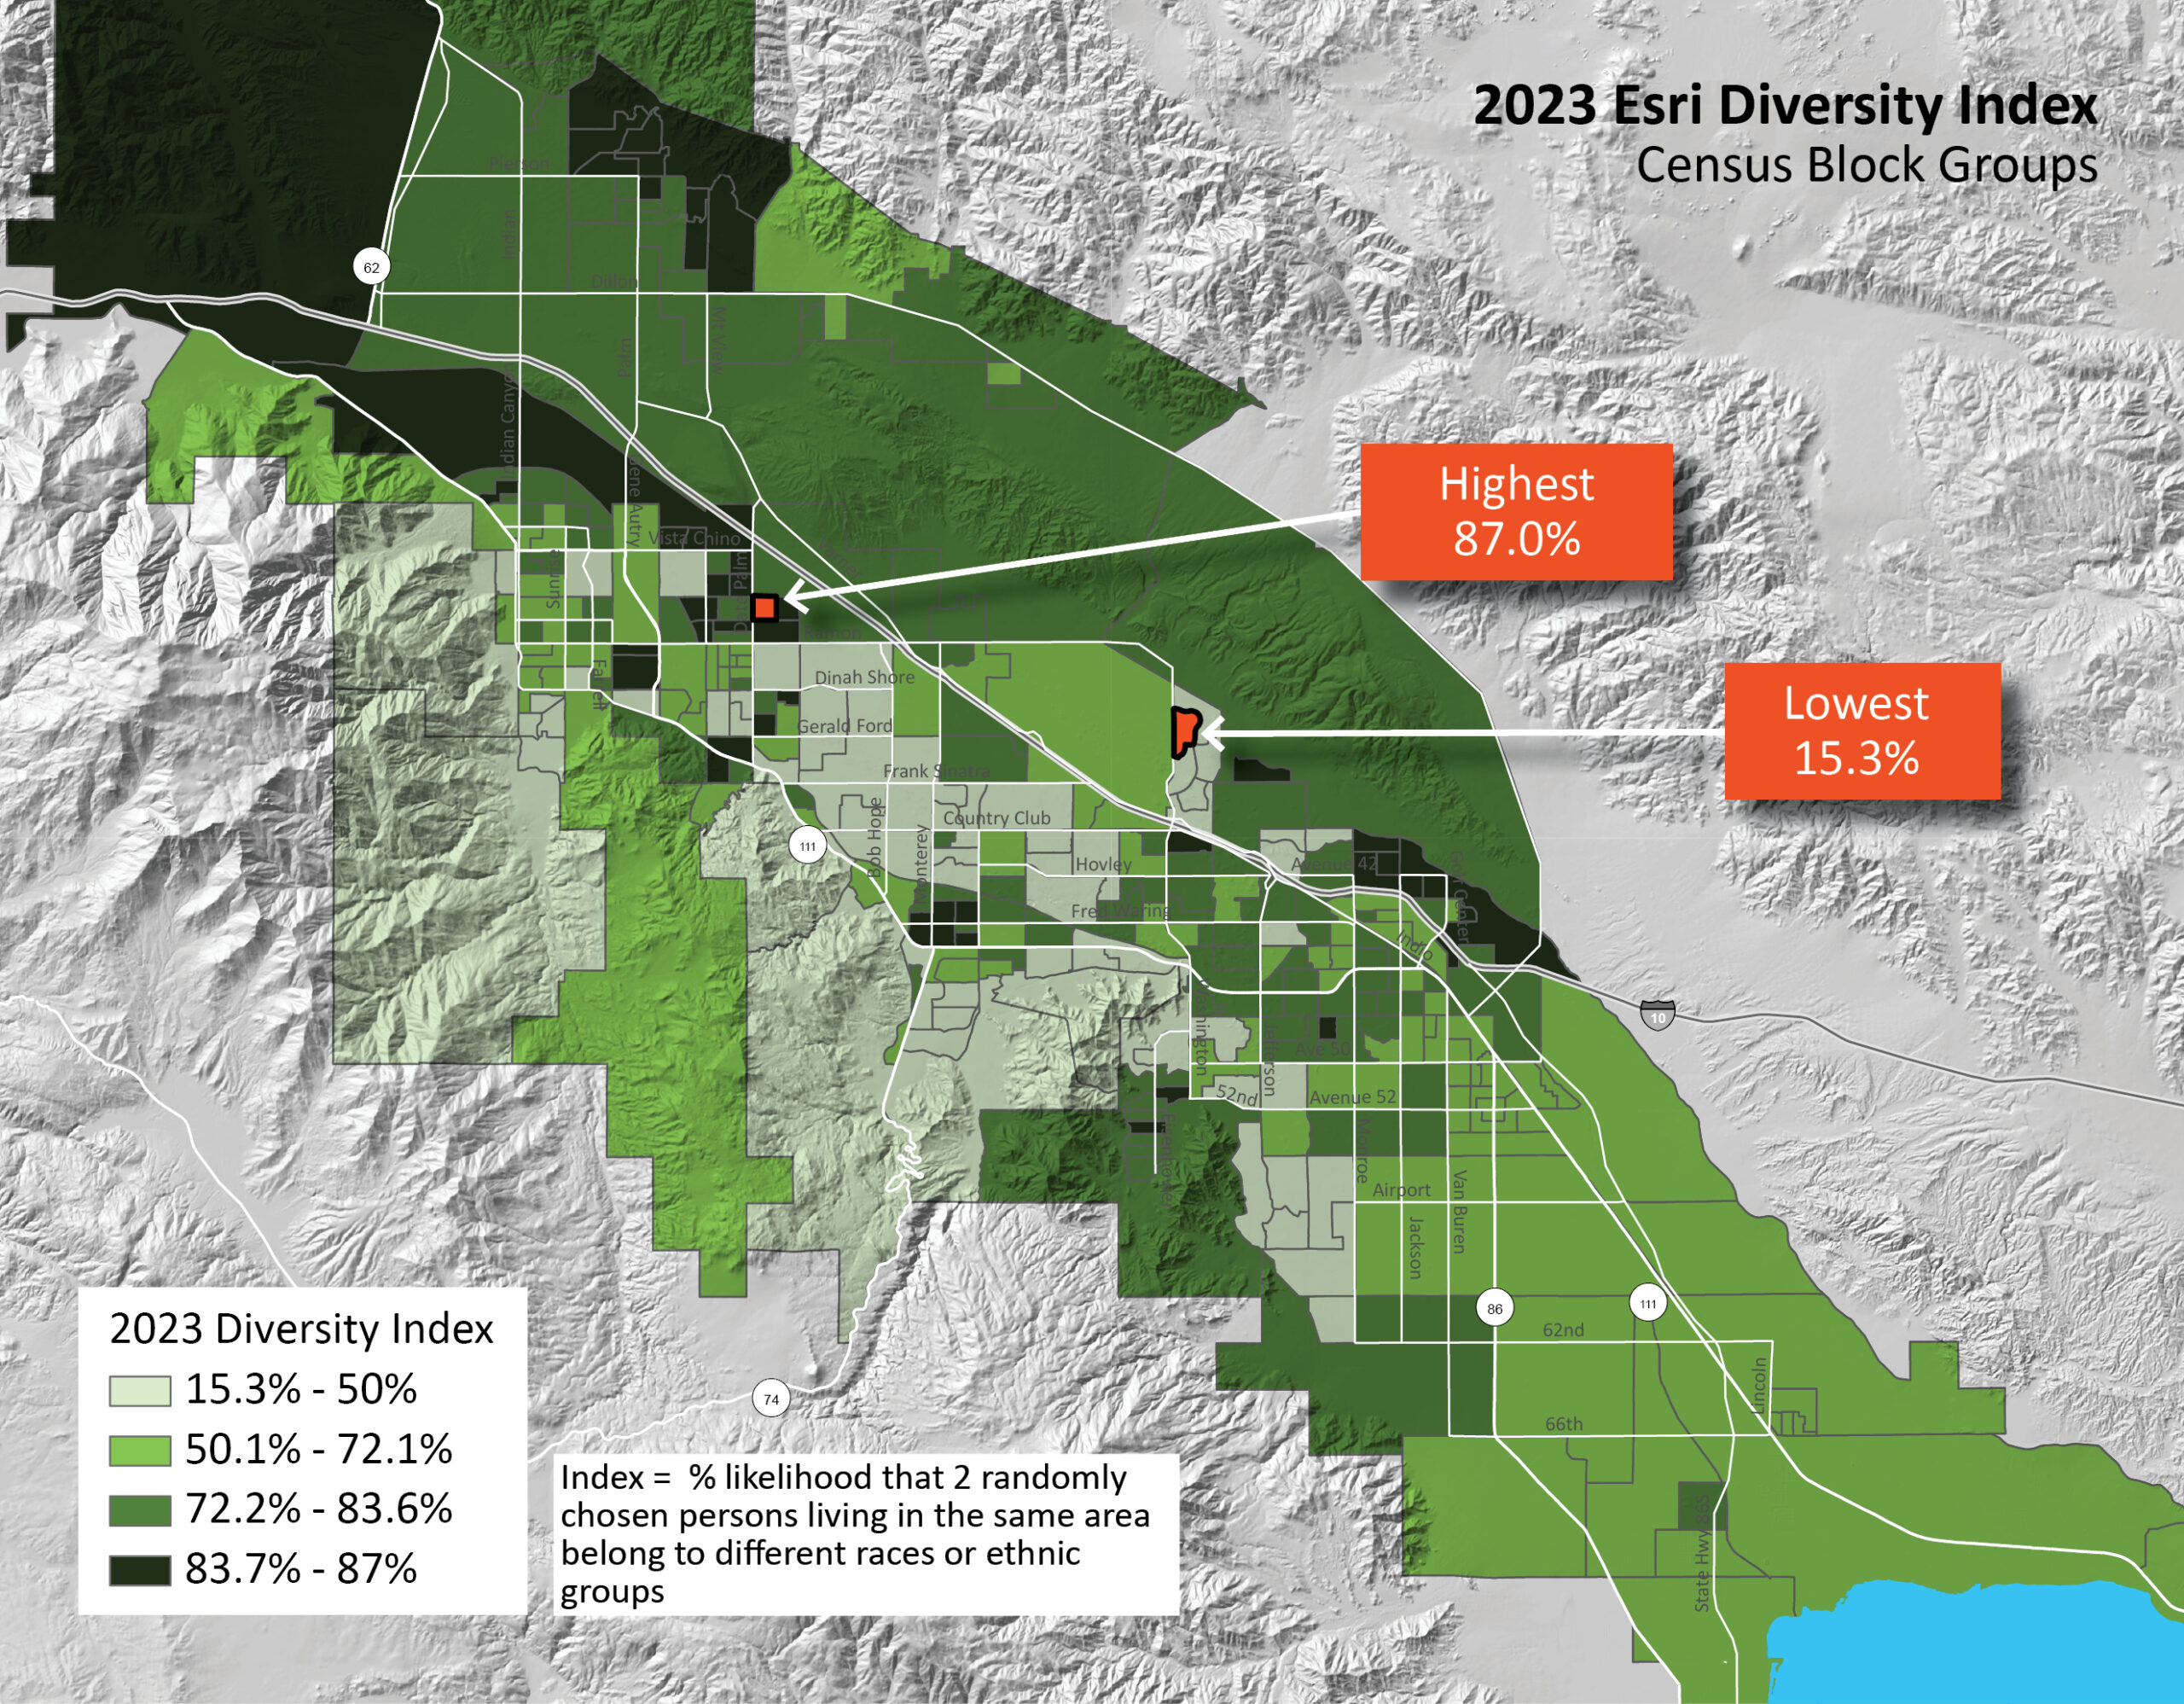
That’s where GIS data and mapping can unearth more compelling stories in your data. Mapping these data at the Census Block group level (the second smallest census geography) displays much more nuance about diversity in our valley. Now you see pockets of high diversity sprinkled all over the region. The numerical breaks in the legend, like 72.1%, were chosen deliberately. The Diversity Index for all of the US is 72.1%. The Coachella Valley as a whole is over ten points higher at 83.6%. Using these breaks allows one to see where the neighborhoods are that are below the US average, and between the US average and the CV average. Now isn’t this a more compelling story about diversity in our Valley?
I would love to help you with any local data you are having a hard time finding. Reach out to me at david@cvep.com. And November 15 was GIS Day! Celebrate!


