

Last time we looked at valley business sector rankings by total number of businesses. Now we change the focus to employment. How do valley business sectors (by NAICS code) rank if we look at their total employment? You will see that the rankings change quite substantially.
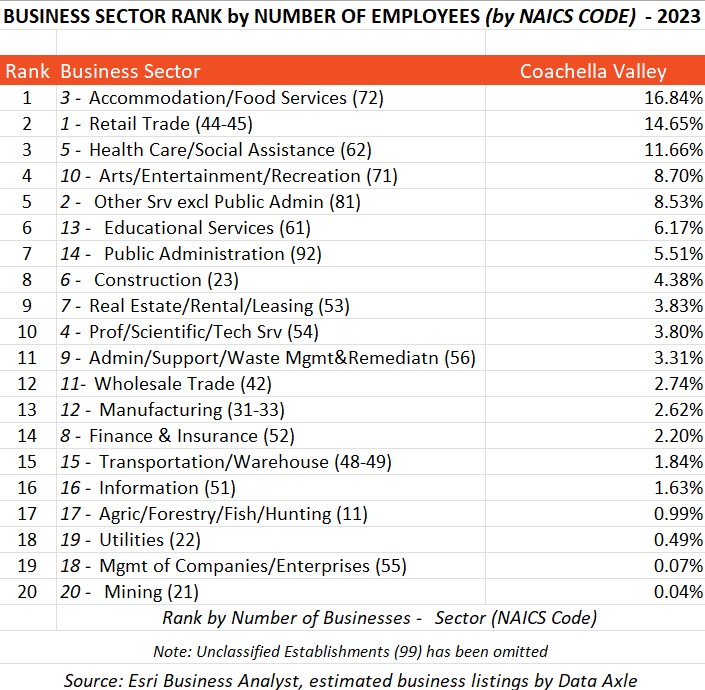
This table ranks Coachella Valley business sectors from 1 to 20, utilizing NAICS sector codes. Instead of looking at the total number of business establishments in each sector, we rank by the total number of employees in each sector. We have omitted NAICS 99 – Unclassified Establishments, so the percentage column will not add up to 100%. The leading italicized numbers in the Business Sector column show the original ranking by total business establishments. Take a minute to look at the opposing rankings and contemplate what might account for this.
The biggest discrepancies are the Educational Services and Public Administration sectors. Each moves up 7 spots in the rankings when considering employment. These sectors comprise “businesses” with large employment but relatively few establishments. Think of 3 School districts, several colleges, and a community college. And the valley is comprised of 9 cities. Large employers, relatively few establishments, especially compared to Accommodation/Food Services and Retail trade. The Other Services sector represents many small businesses with few employees.
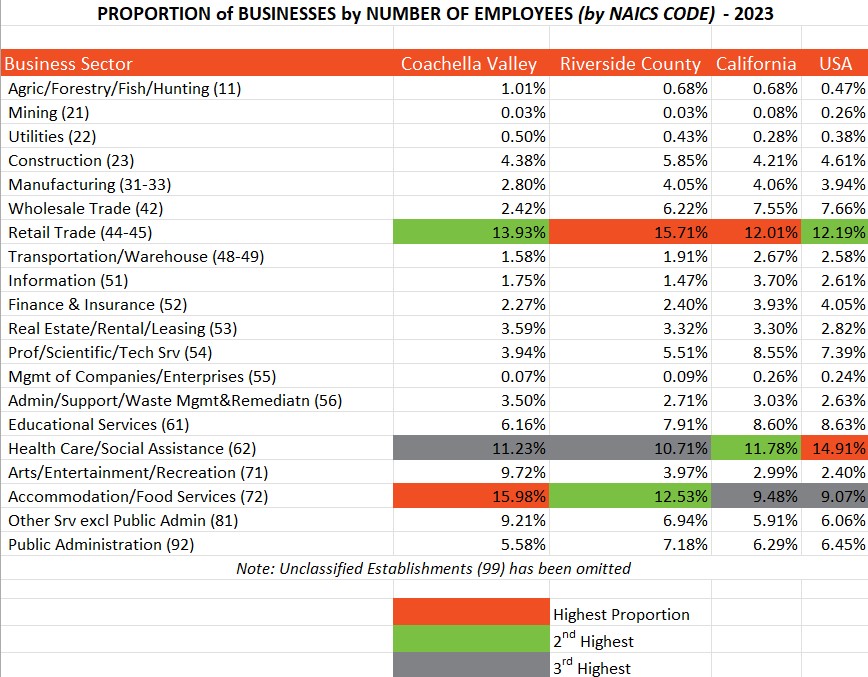
This table compares the proportions of business sectors in the Coachella Valley with Riverside County, California, and the U.S. When ranking for total business establishments, the predominant sector was Retail Trade for every geography. But here, ranking by employment, the valley, and the U.S., one sees the most employment in Accommodation/Food Services. But Retail Trade dominates in Riverside County and the whole of California. In any given region, three sectors predominate: Retail Trade, Health Care/Social Assistance, and Accommodation and Food Services. The Coachella Valley’s reliance on tourism is reflected in two sectors – Retail Trade and Accommodation/Food Services – accounting for nearly 30% of all employment, almost 10% higher than the proportion in the entire U.S.
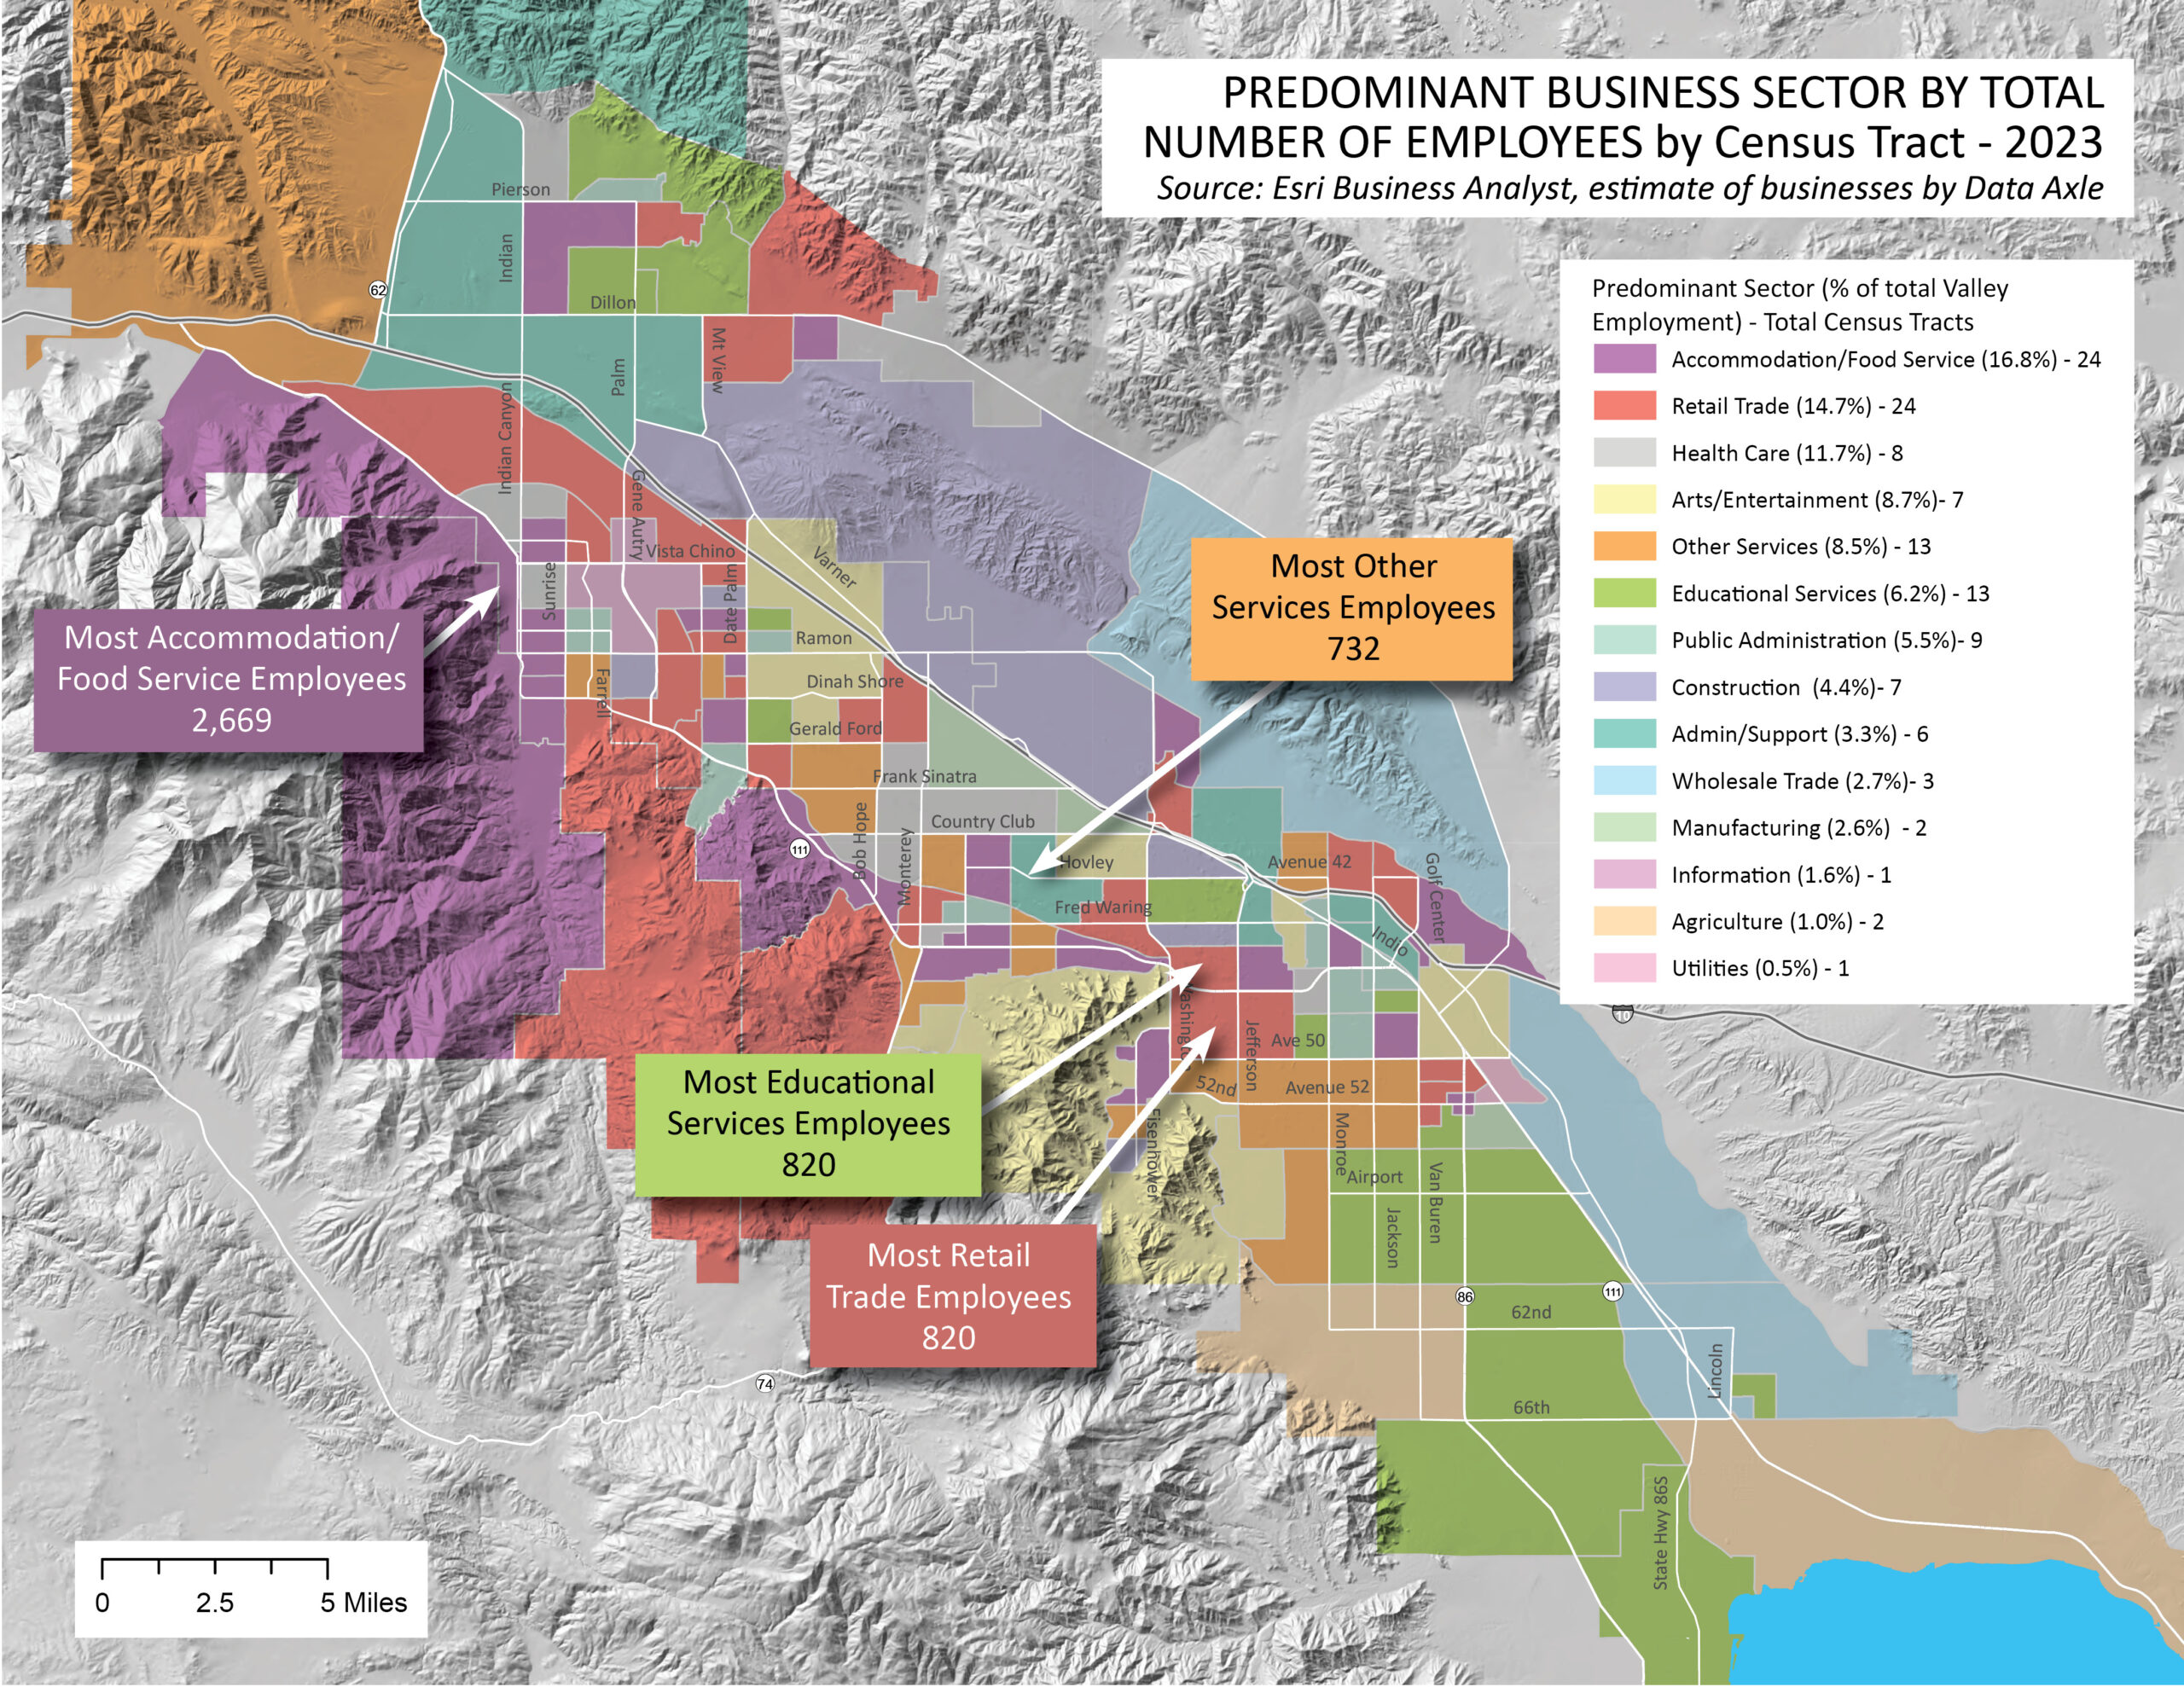
This map displays, by census tract, the predominant business sector based on total employment. The legend shows the sectors ranked in order of predominance (% of total valley employment), like in the first table above. The numbers following the Business Sector name show how many census tracts (out of 120) have this sector as the predominant employer in that tract.
Having 16 unique sectors to symbolize is not good cartography. But it does show the wonderful kaleidoscope of business sectors across the valley. Even then, 6 sectors are missing from the map: Real Estate (3.8%), Professional/Scientific/Tech (3.8%), Finance & Insurance (2.2%), Transportation/Warehouse (1.8%), Management (0.7%), and Mining (0.4%). None of these sectors predominates any one census tract.
The four callouts show where four major employment sectors have the highest employment. Note that Other Services and Educational Services are not the predominant employment sectors in their respective tracts. But still, this is where they employ the most. These are tracts with a high concentration of jobs.


