

Today’s Data Digest is the last of a three-part series. This series has explored rankings of business sectors in the Coachella Valley. We’ve ranked them by total number of businesses. We’ve ranked them by total number of employees. Now we will rank them by total annual sales. Having completed our rankings exploration, we can now discover some interesting patterns and surprising anomalies.
![]()
Ranking from 1 to 20, this table lists the valley’s NAICS business sectors by estimated total annual sales. Once again, we have omitted NAICS 99 – Unclassified Establishments, so the percentage column will not add up to 100%.
Buying and selling items and commodities dominates annual sales in the valley. Retail and wholesale trade account for nearly 50% of total estimated annual sales. In the third-ranked sector, Accommodation/Food Services, annual sales drop 14% from Retail Sales.
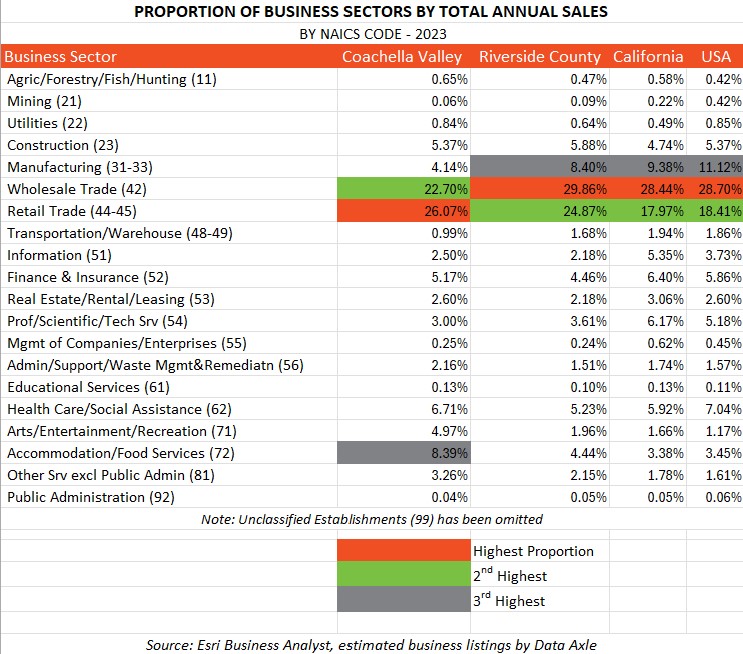
This table compares business sector proportions in the Coachella Valley with Riverside County, California, and the U.S. As is typical, the top two dominant sectors by annual sales are shared by all three geographies: Wholesale and Retail Trade. But we flip with the other areas. Wholesale trade is number one everywhere else, but Retail Sales dominates annual sales in the valley. This a region dominated by tourism, so it’s no surprise Retail Sales would beat out Wholesale Sales. The biggest difference is in the third ranking. Again, not surprising. Accommodation/Food Services is our number three, while Manufacturing is number three everywhere else.
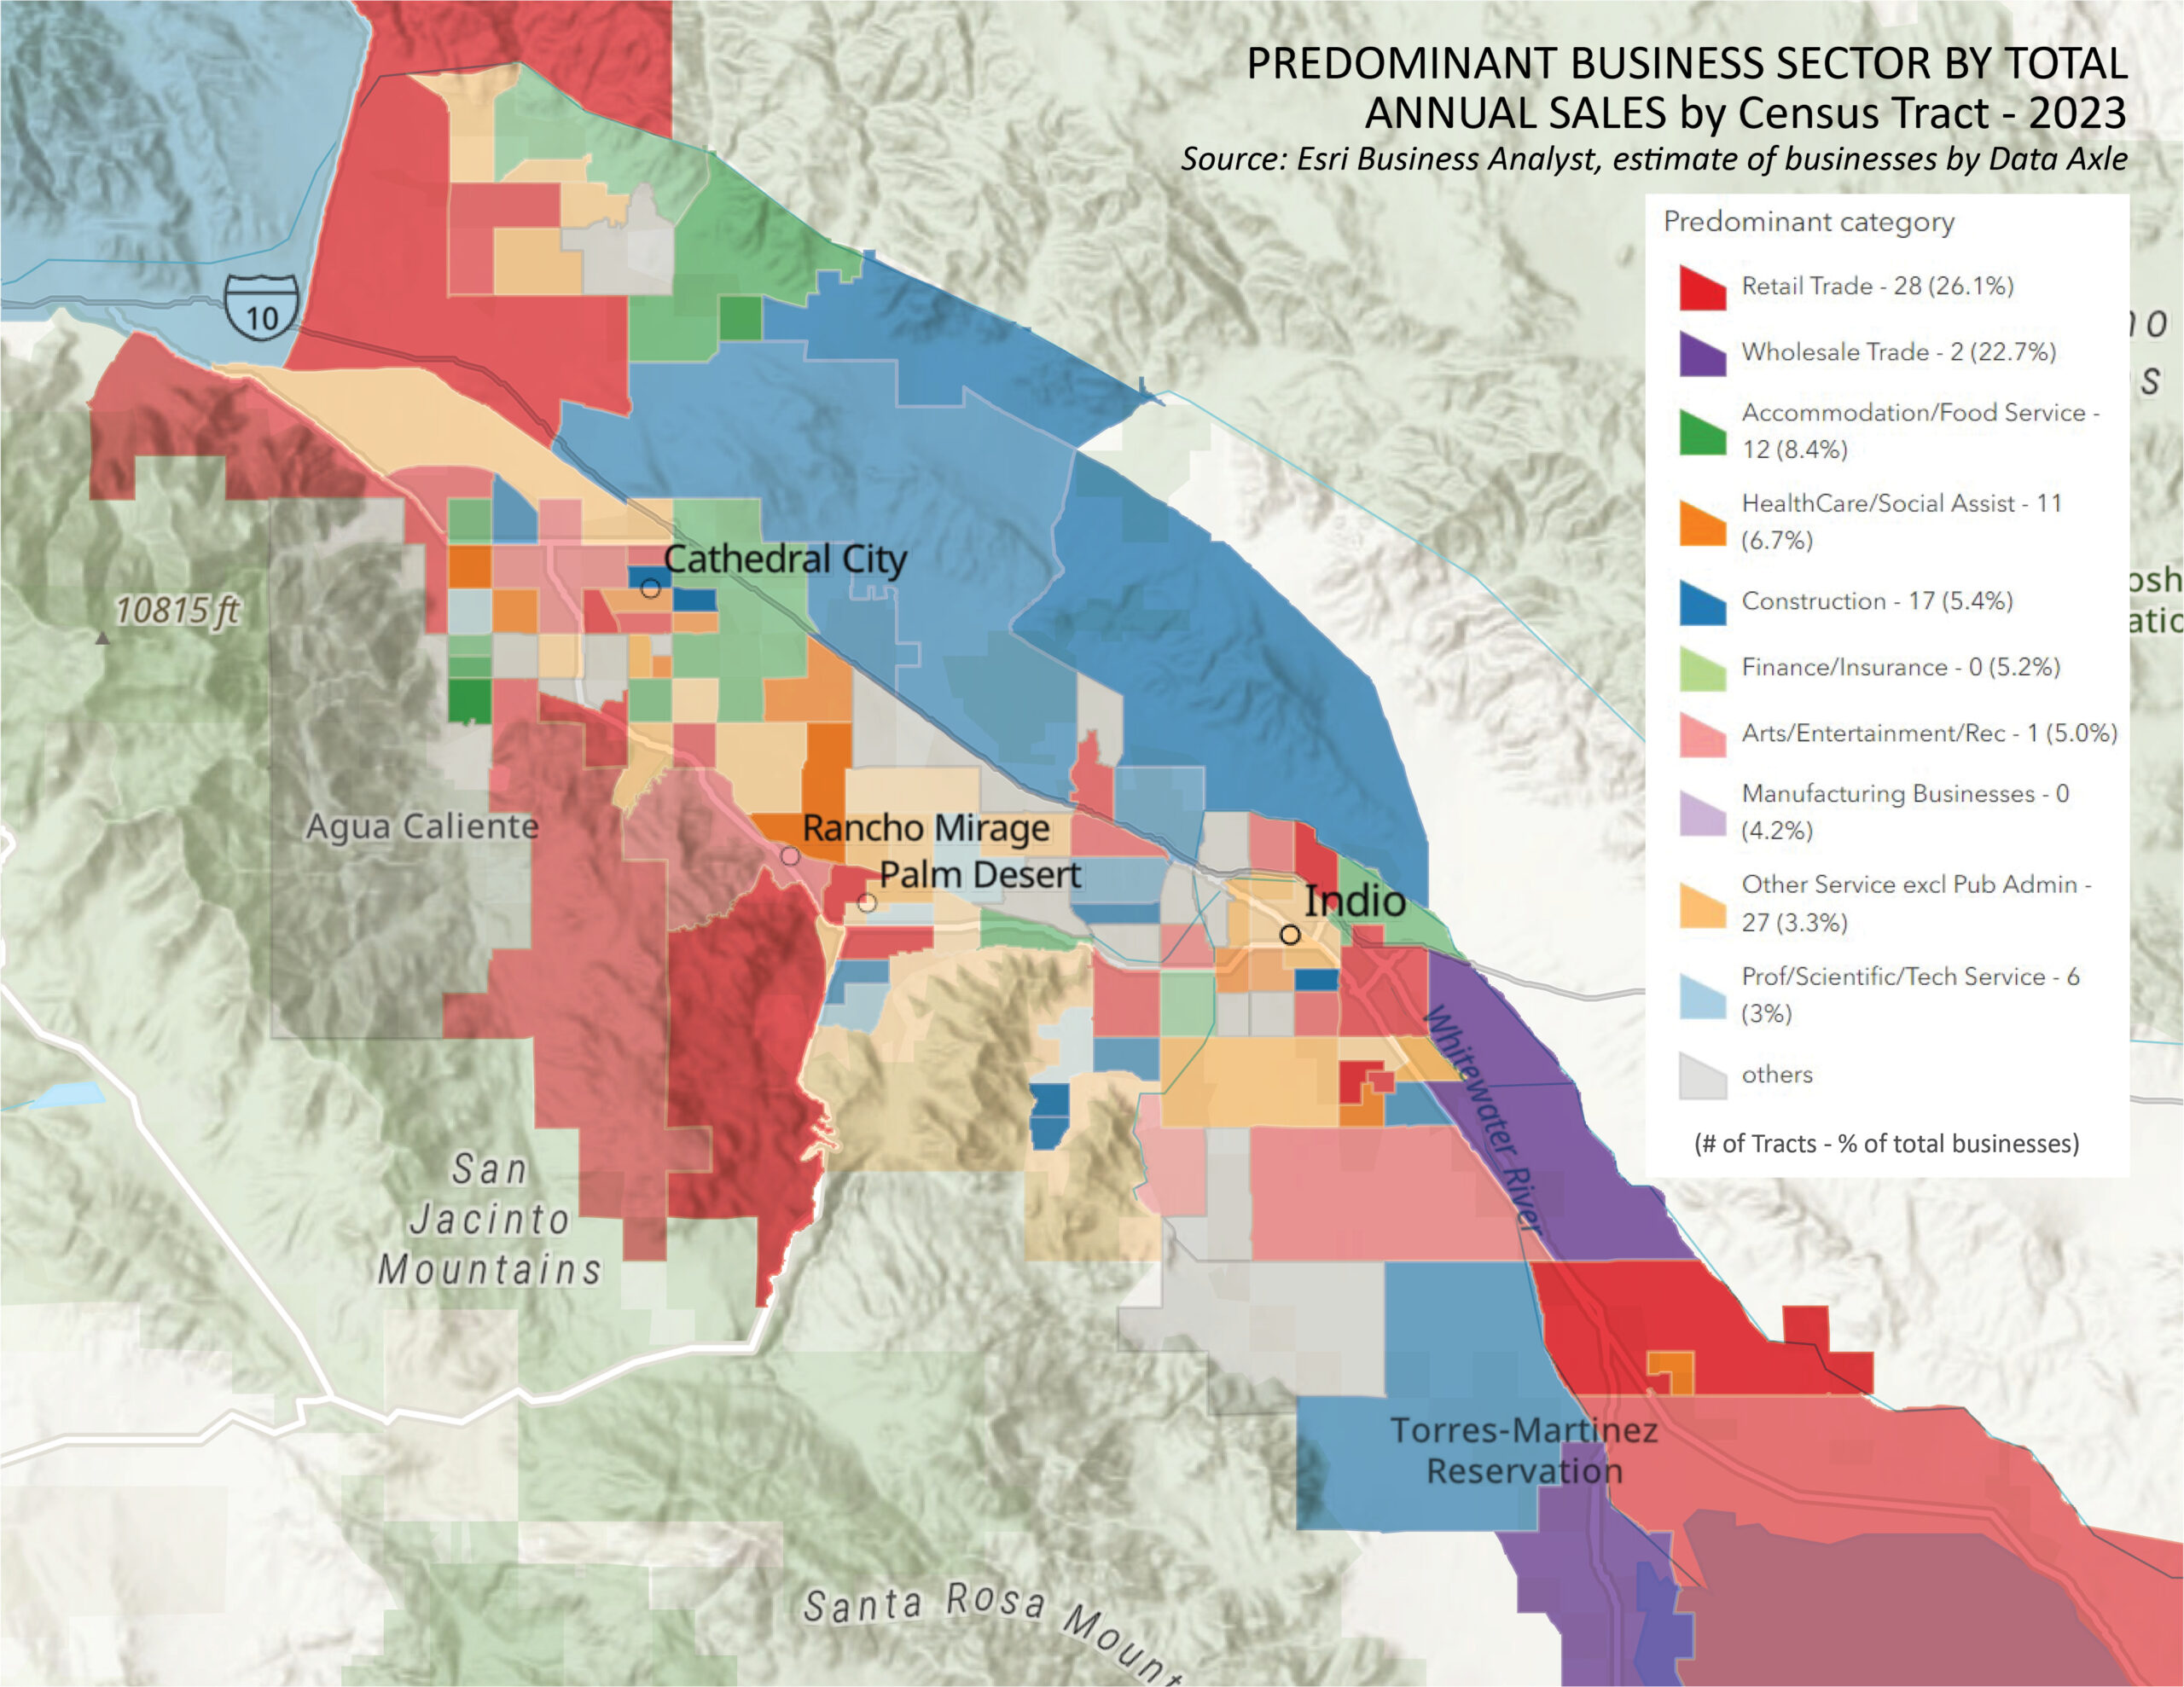
Our final map in the series reveals, by census tract, the predominant business sector based on total annual sales. The first number after the sector name in the legend shows how many census tracts, out of 120, have that dominant sector as the leader in sales. The (%) shows the proportion of total annual sales in the valley of that specific sector, like in the first table above.
Of course, Retail Trade wins the total number of census tracts. However, Wholesale Trade, with 23% of all annual sales, dominates only 2 tracts in the East Valley, reflects extensive agricultural trade in this area.
Two sectors stand out. Other Services, ranked 9th by sales, is just below Retail trade in tract dominance. The Coachella Valley has a surprisingly high number of service businesses that serve the tourism industry and the second home and snowbird populations. They are spread throughout the central spine of the valley. Next comes the Construction sector with 17 tracts. Many construction-related businesses are located north of Interstate 10.
Even though they are in the Top 10 of annual sales, the Finance/Insurance and Manufacturing Sectors do not dominate in any tract in terms of sales. And Arts/Recreation dominates in only one tract.
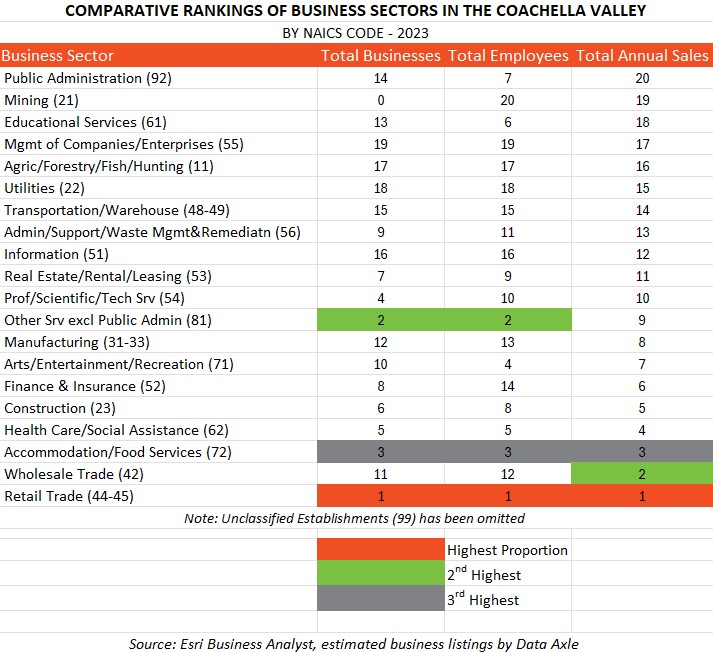
Now that we have studied rankings of Coachella Valley business sectors by the three metrics – total number of businesses, total number of employees, and total annual sales, we can see how each metric compares. By now I bet you guessed that Retail Trade is number one in every metric.
We are also a valley of small businesses that support the varied facets of the local economy and population. So, the Other Services sector dominates in total number of businesses and total employees. However, since these are predominantly small businesses, their total annual sales rank #9 with 3.3% of total annual sales in the valley.
In total sales, Wholesale Trade comes in second, with nearly one quarter (23%) of total annual sales. Despite this sales dominance, Wholesale Trade ranks a little below the midpoint by both the total number of businesses (11th rank) represented and total employment (12th rank.)


