

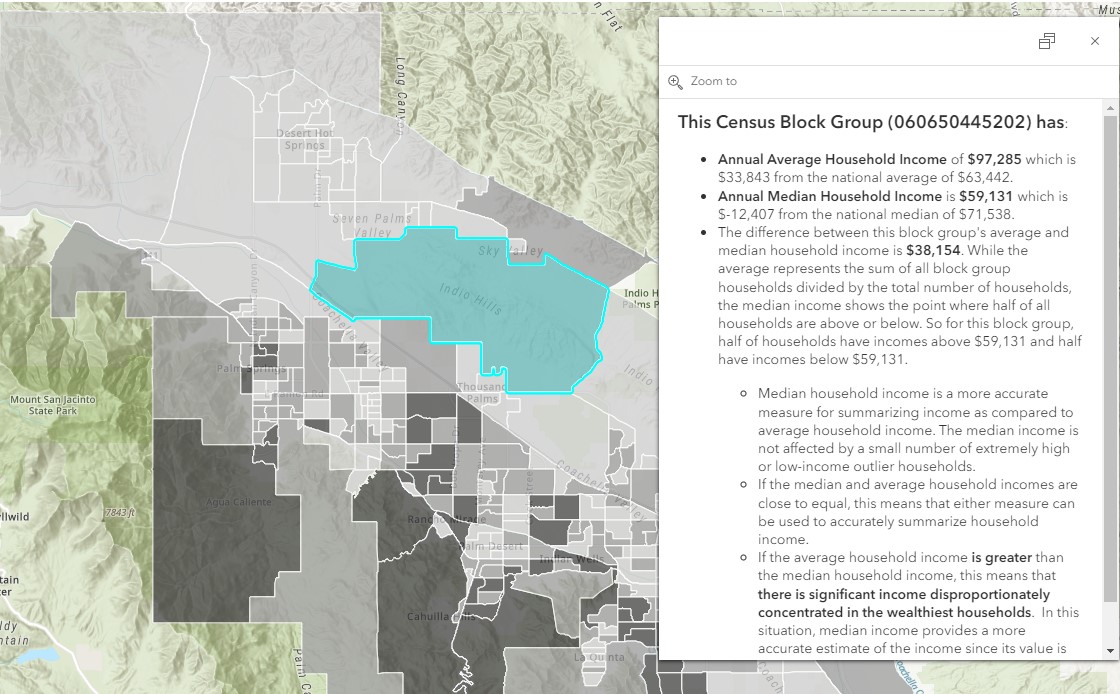
For today’s Data Digest, we are shaking things up a bit. Prepare to get interactive! Instead of a static map and commentary, today we present to you an interactive web map application. This web map allows you to investigate household income statistics at the Census Block Group level. Click here to explore today’s map more deeply. You can pan and zoom just like in Google Maps. With the Basemaps button, you can change to an aerial photo map on which to display the layers. Choose between layers like Household Median Income or the Difference between Local incomes and National averages. Check out the statistics for your neighborhood in the valley. Be sure to click on a block group on the interactive web map to see a pop-up window presenting a synopsis of the income value for your chosen block group. Have fun!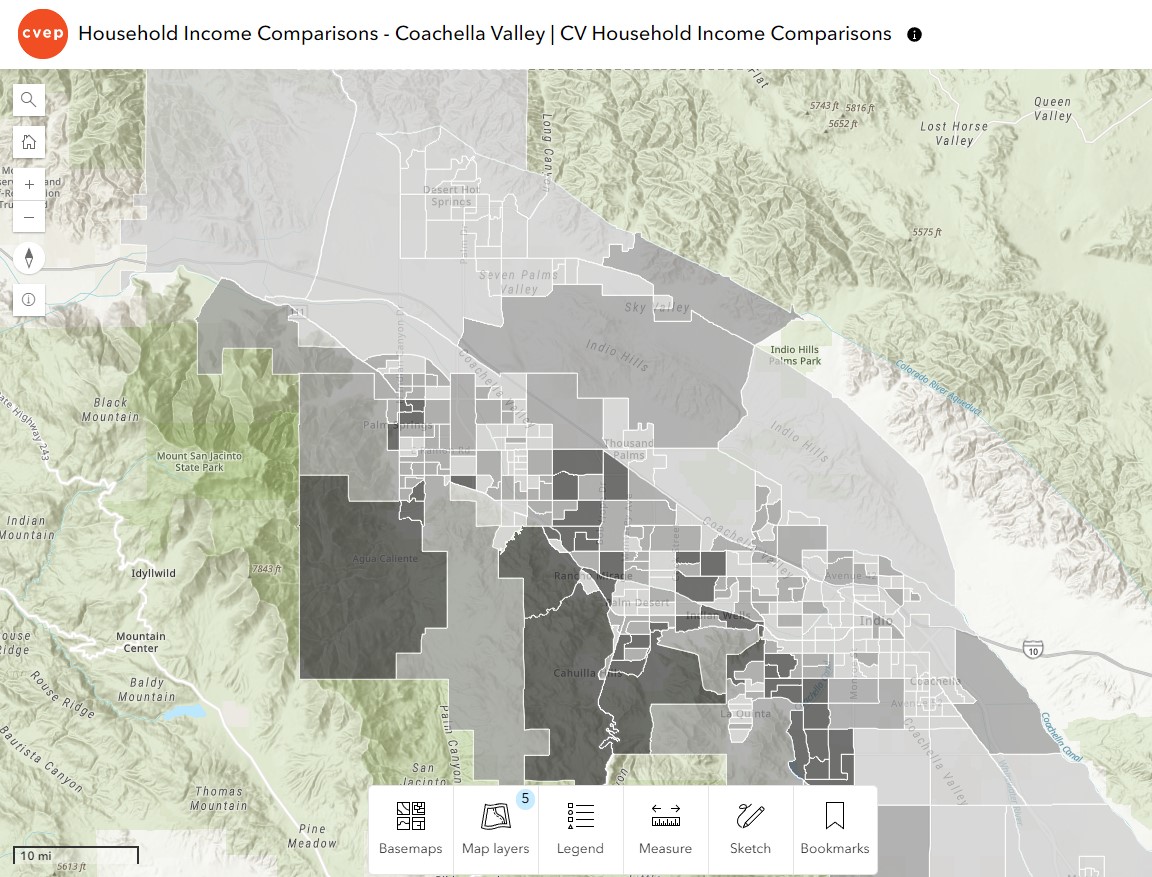


