
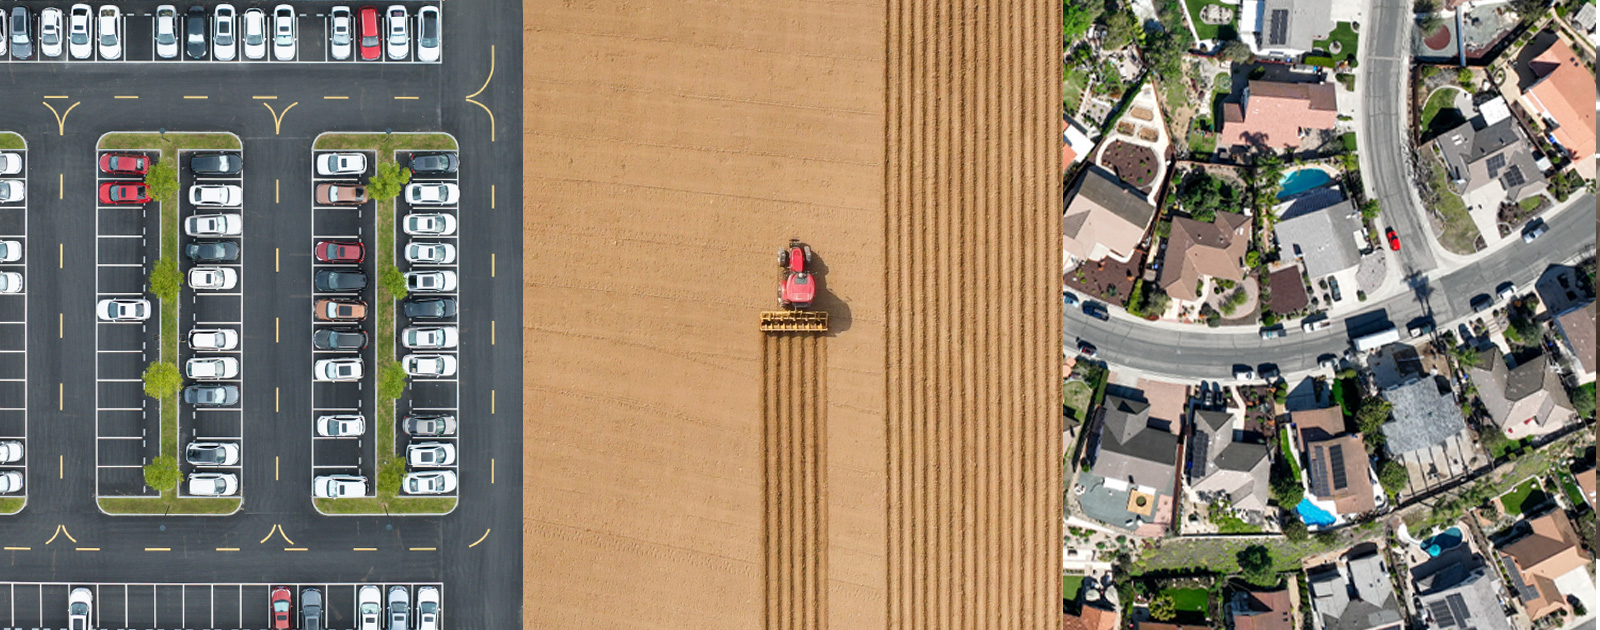
As any of you who have read my Data Digest can tell, I can’t get enough of graphs, tables, and infographics. One of my go-to sites for infographics about the economy is Visual Capitalist. Recently I stumbled on one of their older articles titled Mapped: The Anatomy of Land Use in America (and I can never resist a title with “mapped” in it). Here they map some fascinating work by the McHarg Center of the University of Pennsylvania that studied land use in America for their “2100 Project: An Atlas of the Green New Deal.” And of course, it got me thinking. What does the distribution of land use in the Coachella Valley look like?
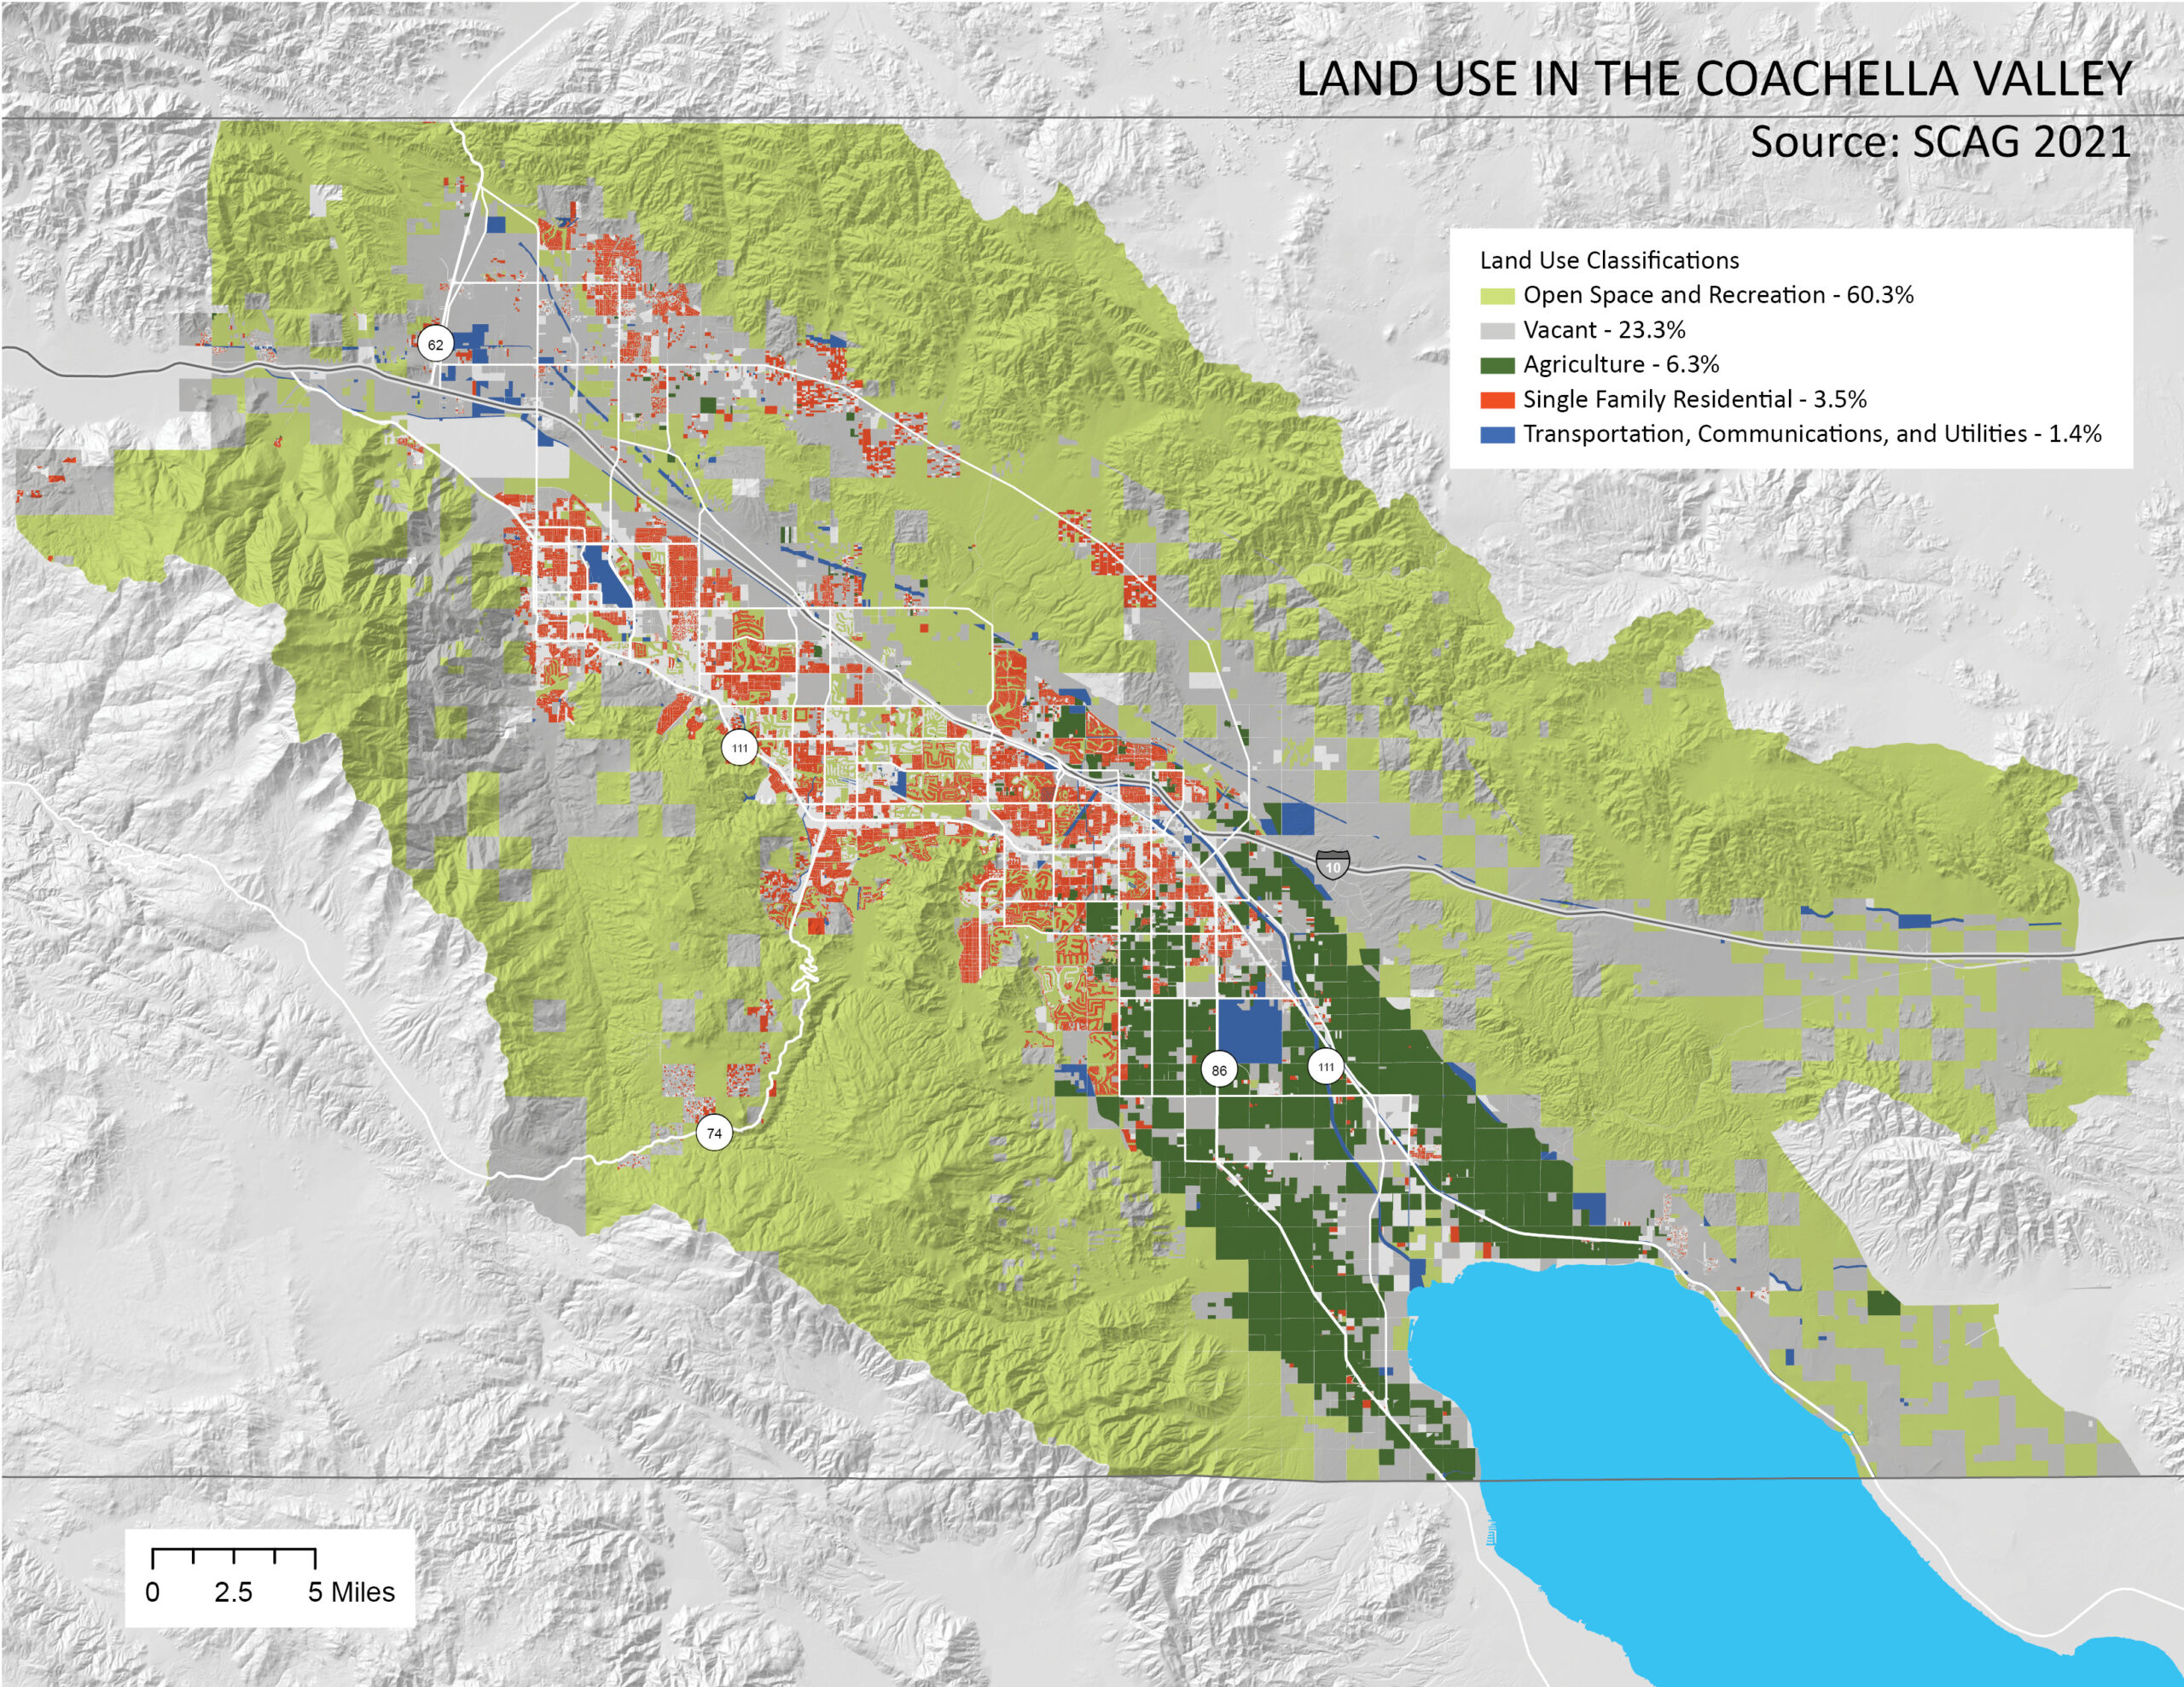
Here is a map of the top 5 land uses by total area in the Coachella Valley. These data come from the Southern California Association of Governments (SCAG). The parcel-level data were comprised from Assessor’s tax roll records for the Southern California region. Each jurisdiction has its own land use codes and descriptions. SCAG compiled these into their own simplified taxonomy. So close inspection of city and county-level land use maps may not completely match with this map. But this does give one a chance to look at regional-level land use patterns.
No official border of the Coachella Valley exists. At CVEP, we use the ridge lines of surrounding mountains and foothills along with the county borders to establish our border. We used this boundary to “clip” SCAG’s land use layer to determine land use proportions in our valley.
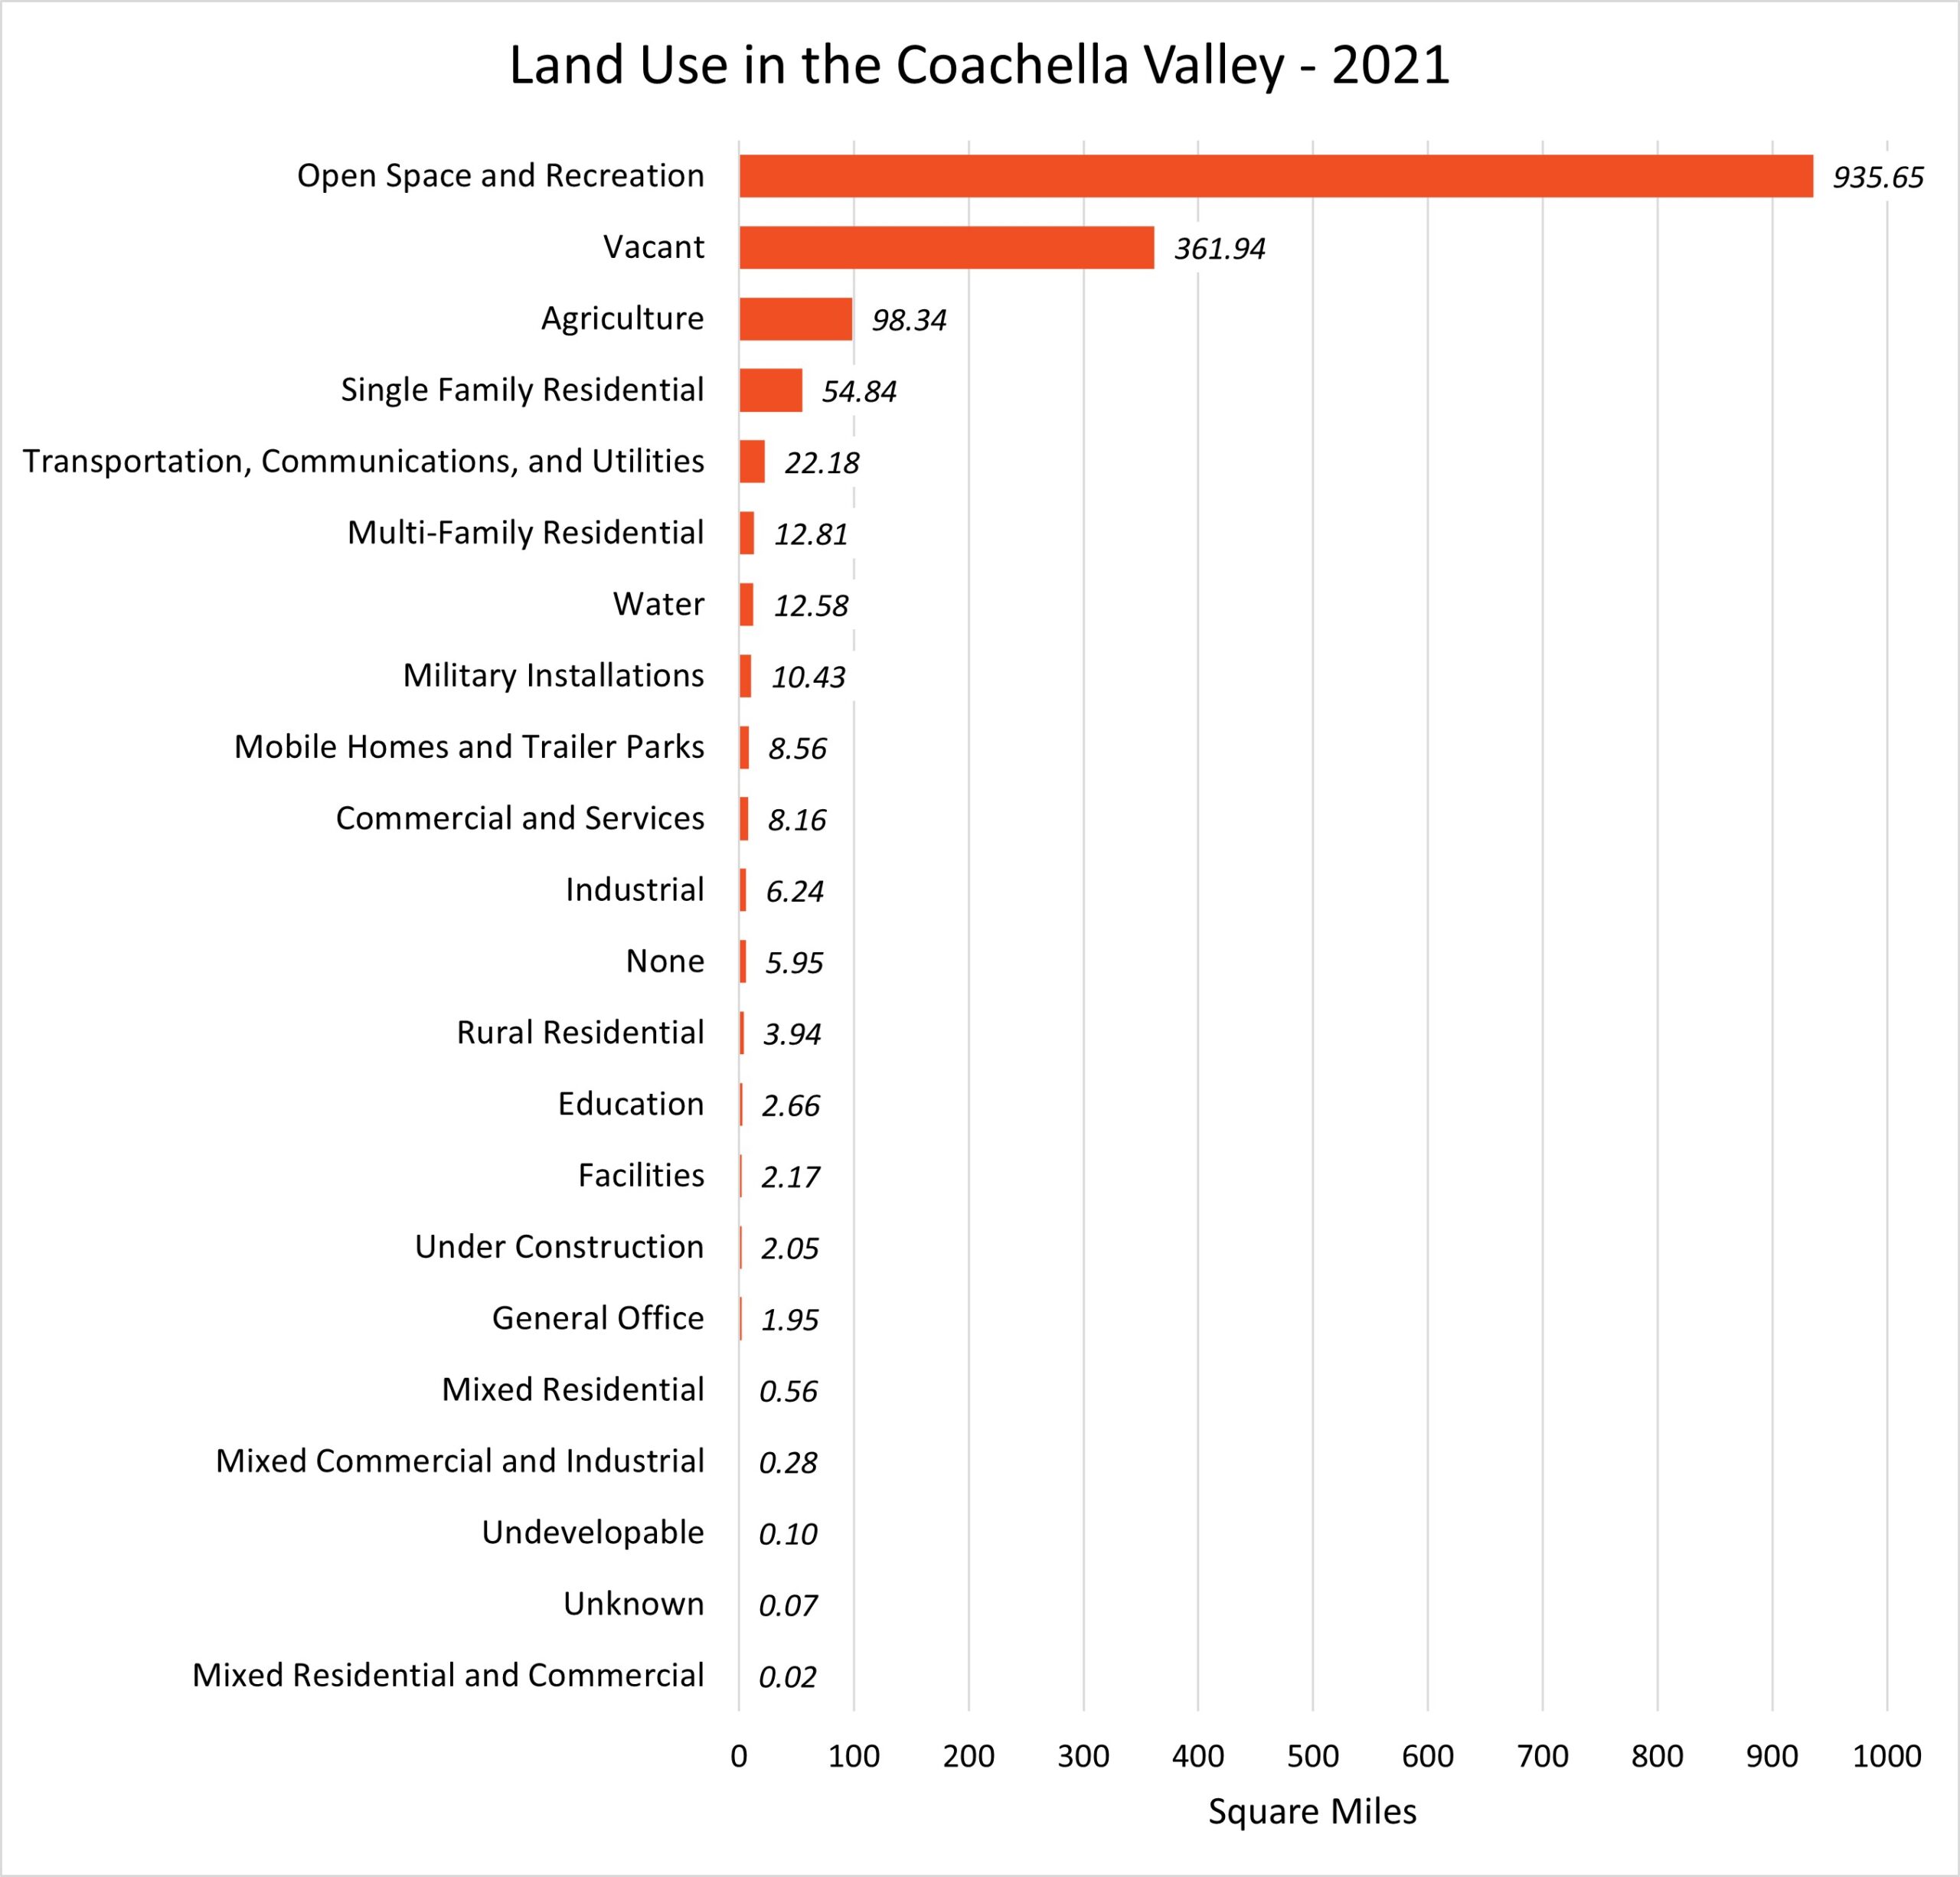
Here you see the SCAG land use categories ranked by total area in the Coachella Valley, by square miles. It should come as no surprise that Open Space and Recreation represents nearly two-thirds of land use in the valley. If we were to pull in our boundary to the base of our surrounding mountains and foothills, representing more of the developed land, these land use proportions would be much different. But the surrounding open space of National Parks, Monuments, National Forests, and State park areas are part of what makes our valley so special.
In SCAG’s taxonomy, vacant land represents undifferentiated land, abandoned agricultural areas, urban vacant lots, and land with limited improvements.
According to the 2100 Project Atlas, the lower 48 states’ land use is distributed as such:
- Forests – 27% Oregon and California have the most forested land
- Shrubland – 24%
- Agriculture – 17%
- Grasslands and Pasture – 17%
- Wetlands – 5%
- Other – 3%
- Open Space – 3%
- Urban Areas – 2% 82% of the U.S. population lives in this 2%


