Regional economic development depends on cooperation. It cannot be done alone. Over the last year, I have collaborated with Sean Smith, Visit Greater Palm Springs (VGPS)’ Director of Economic Development. VGPS generously purchased a database helping both of our agencies better understand the industry sectors and jobs specific to the Coachella Valley. Sean and I have had so much fun digging through this invaluable data.
One metric used to measure the specialization or concentration of an industry sector or occupation in a region is Location Quotient (LQ). LQ is calculated by dividing the regional share of, for example, employment in the agriculture sector by the national share of the same employment. So, an LQ above 1.0 means your region is more specialized or concentrated in that sort of employment than the nation. In today’s Digest, we will look more closely at Location Quotients in the Coachella Valley.
Locations quotients help communities identify industries or occupation groupings that are specialized or truly unique in a region. Clustering can increase productivity and innovation. Being close can encourage the informal exchange of ideas, and sharing of best practices, and enhance problem-solving. Specialized suppliers can be located to support these clusters. Clusters provide better access to distributors. They stimulate economic growth in a region and attract investment. Famous examples include Silicon Valley and Hollywood. So understanding our regional specialization and clustering can boost regional economic activity.
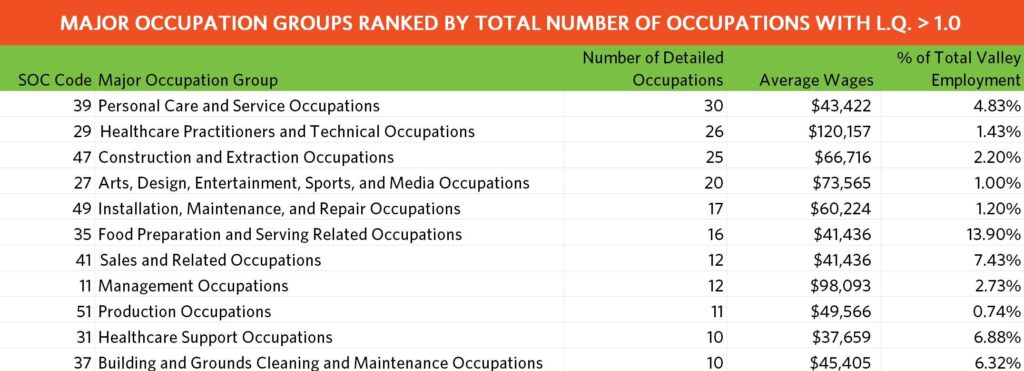
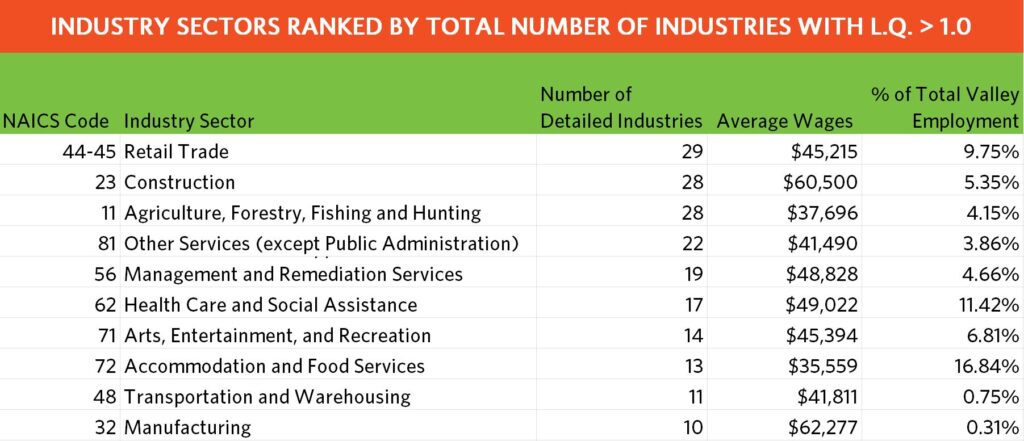
The two tables above rank the major occupation groups (utilizing Federal Standard Occupational Classification (SOC) codes) and industry sectors (utilizing Federal North American Industry Classification System (NAICS) codes) with location quotients above 1.0, or the national average. Farming occupations are five times more concentrated here than nationally. Jobs in the agriculture and arts sectors are 3 and a half times more specialized than nationally. Total employment numbers and average annual wages are for Quarter 2 of 2024.
SOC occupation codes set four levels of aggregation – major groups, minor groups, broad occupation categories, and detailed occupation categories. For this table, I started with a list of detailed occupation categories (like Gambling managers) with LQs above 1.0. From this list, I counted how many of these high LQ detailed occupations were in each major occupation group. You can see the ranking in this table. The column % of total employment indicates the percentage of jobs in the listed occupation group compared to employment in all groups with at least 1 detailed occupation LQ above 1.
NAICS codes have a similar hierarchical structure but with five levels of aggregation – sector, subsector, industry group, NAICS industry, and national industry. I started with a list of national industries (the most detailed business naming, like Citrus groves) with LQs above 1.0. I then counted how many high LQ industry businesses were in each major industry sector. You can see the ranking in this table. The column % of total employment indicates the percentage of jobs in the listed industry compared to employment in the industry groups with at least 1 detailed occupation LQ above 1.
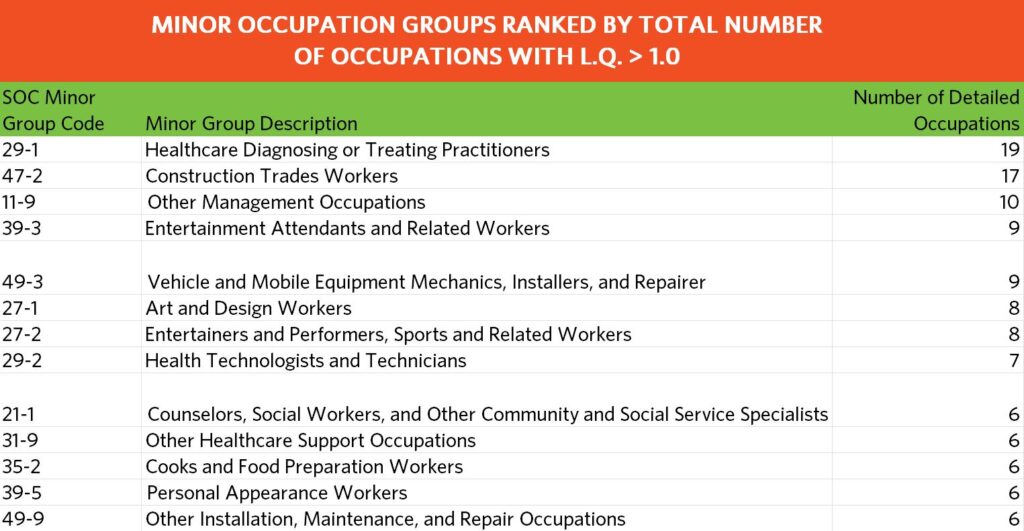
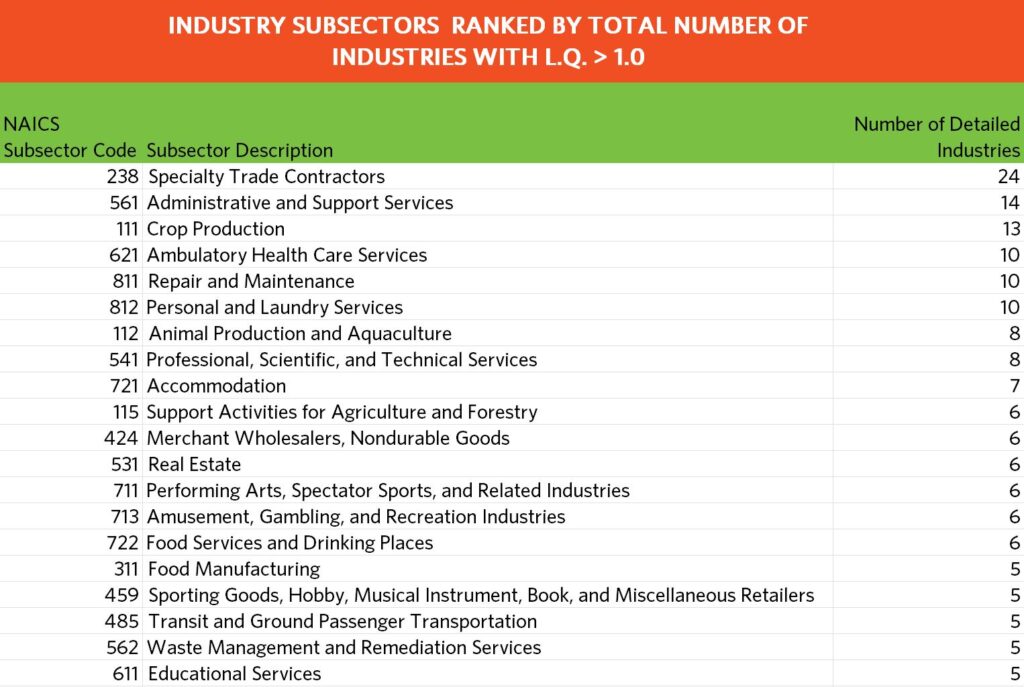
For these last two tables, I used the same detailed lists of the most specific occupations and industries with LQs above 1.0. But here I am using the second tier of SOC codes – minor occupation codes, and NAICS subsectors. This gives you more specificity and description for occupations and industries sectors beyond the highest tiers.
Occupations:
- When detailed occupations are ranked by total employment you must go to rank#20 – Carpenters, to find an occupation with average wages above $74,000
- Ranking by wages, the top 15 are all in the Health Care Practitioners minor group – from Anesthesiologists ($440,500) to Podiatrists ($170,800). But all 15 only account for 0.36% of jobs in high LQ sectors
- The highest demand in the next 5 years for high LQ occupations are Fast Food and Counter workers (7,063)
Industries
- When ranked by total employment in the most specific industries, you must get to #9, Offices of Physicians ($99,190) to get annual average wages above $74,000
- When ranked by wages, the Top 10 are varied from a high of $151,708 for Fossil Fuel Electric Power Generation, to Non-residential structural steel contractors at $99,467. Other industries in the top 10 include Healthcare, Professional-Scientific-Technical, and Manufacturing
- The highest demand in the next 5 years is for Full-Service Restaurants – 10,518


