

At CVEP, we support our iHub clients with customized data to help their businesses grow. In addition, we have worked with many potential businesses contemplating locating in the Coachella Valley. Not knowing our market completely, they are looking for local data matched to their specific business profile. For example, an established retirement community with many amenities wants to build a center in the Coachella Valley. Where is the best place for them to locate? These types of inquiries are perfect for GIS (Geographic Information Systems) analysis. Today I will outline a simple example of how we can help businesses focus on prime locations to serve their prospective customers most effectively.
Say a potential business has created an optimal customer profile. Their typical customer would have an annual household income between $100,000 and $150,000. They would be well educated, with at least a bachelor’s degree or higher. And they would travel more than the national average. With GIS, we can map the concentrations of these customer characteristics and look for where they overlap geographically.
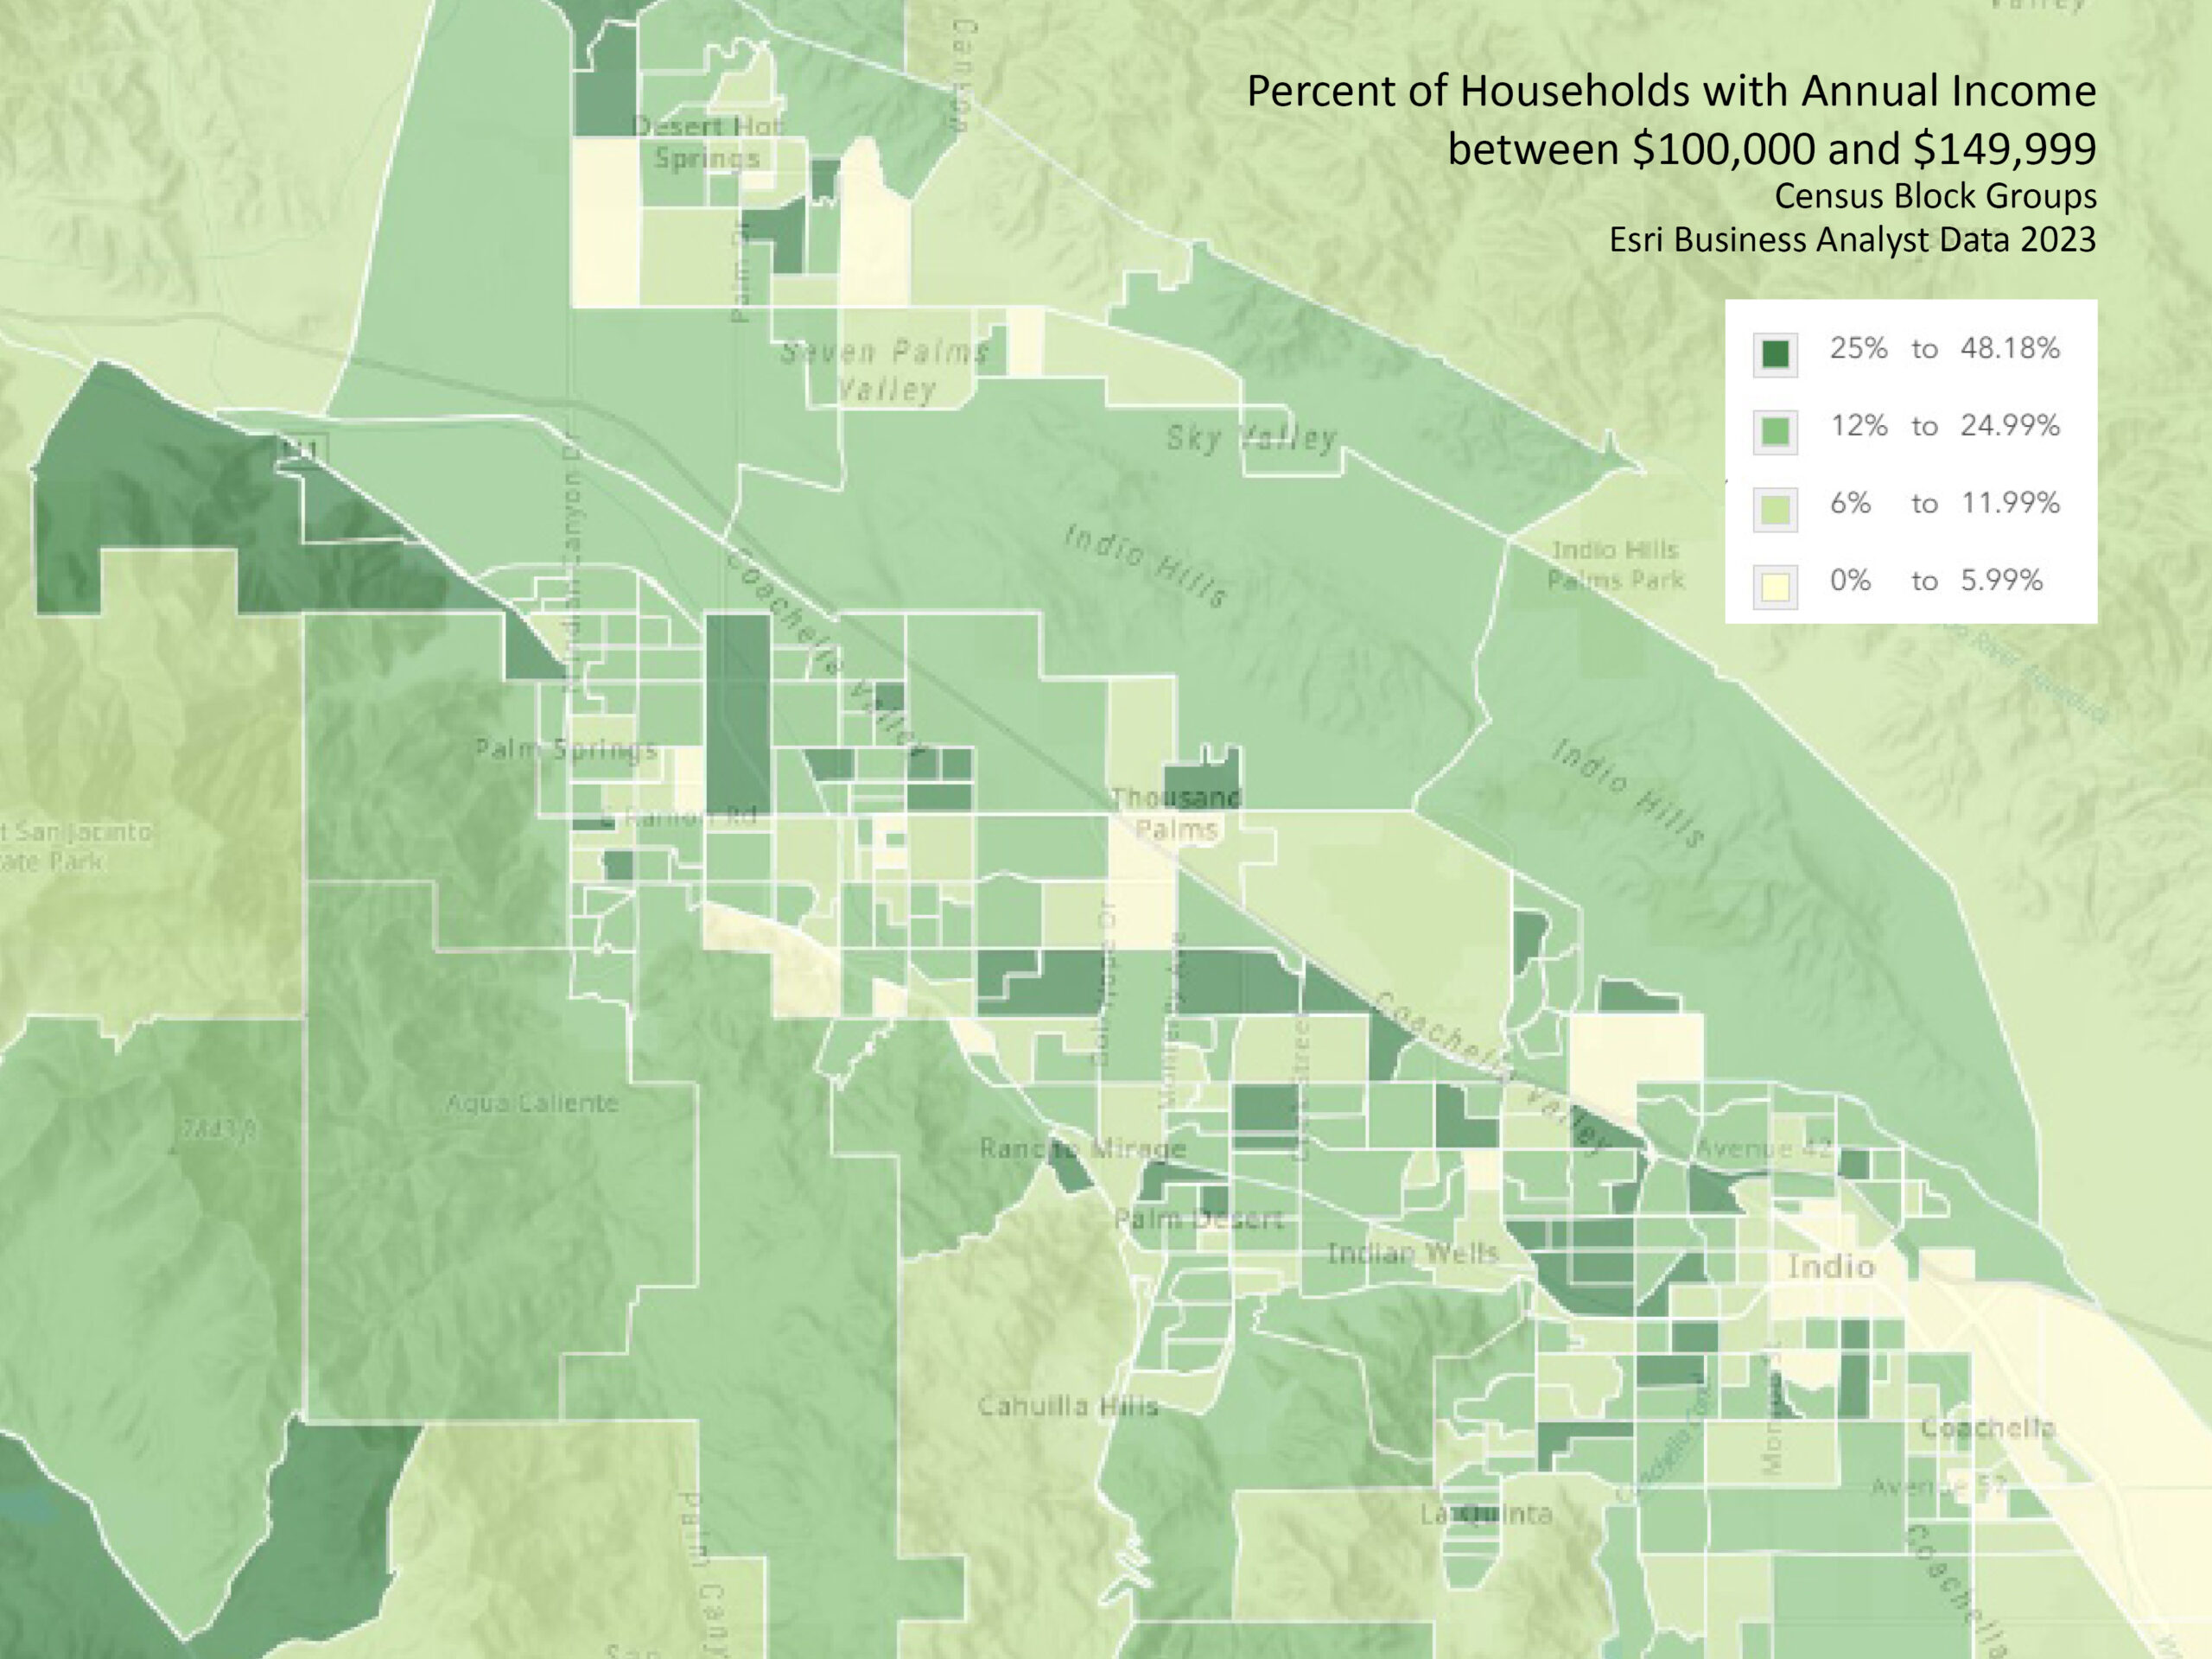
This first map shows the distribution of annual household income by Census Block Groups. The darkest green areas are where at least 25% of households within the block group have income to match the potential business customer profile.
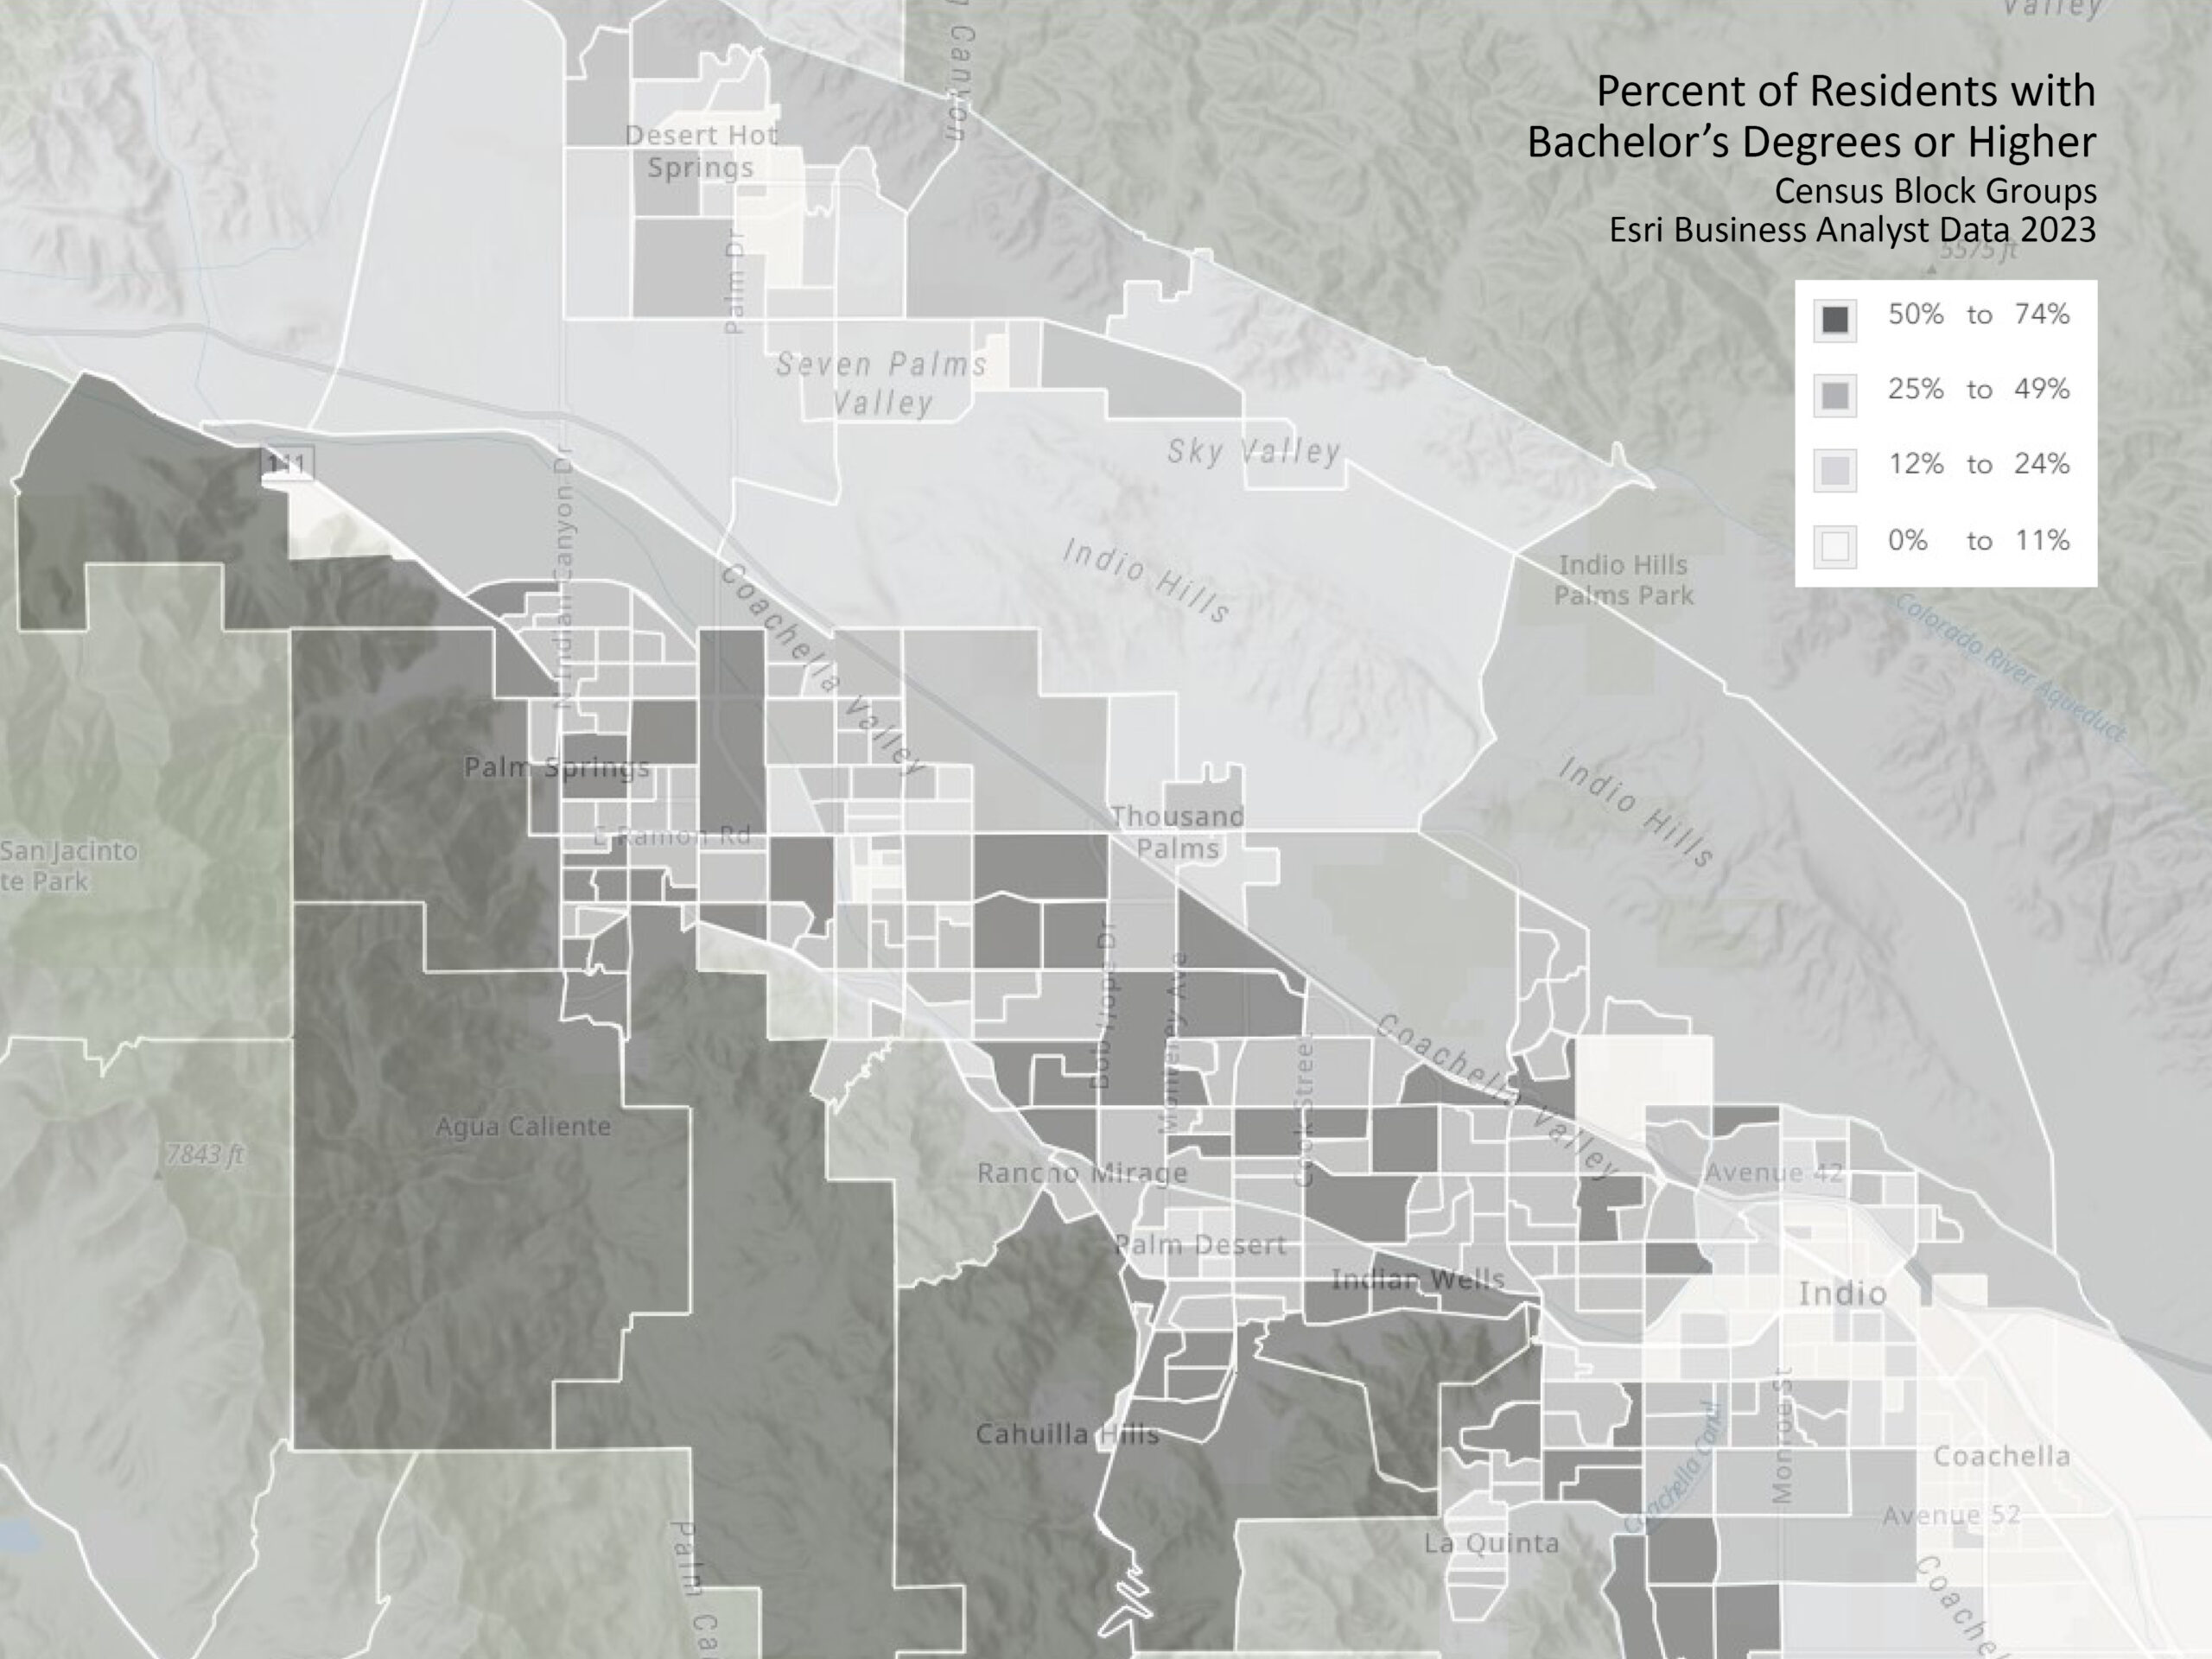
This map shows which block groups have residents with bachelor’s degrees or higher. For the darkest areas, 50 to 74 percent of residents have such educational attainment.
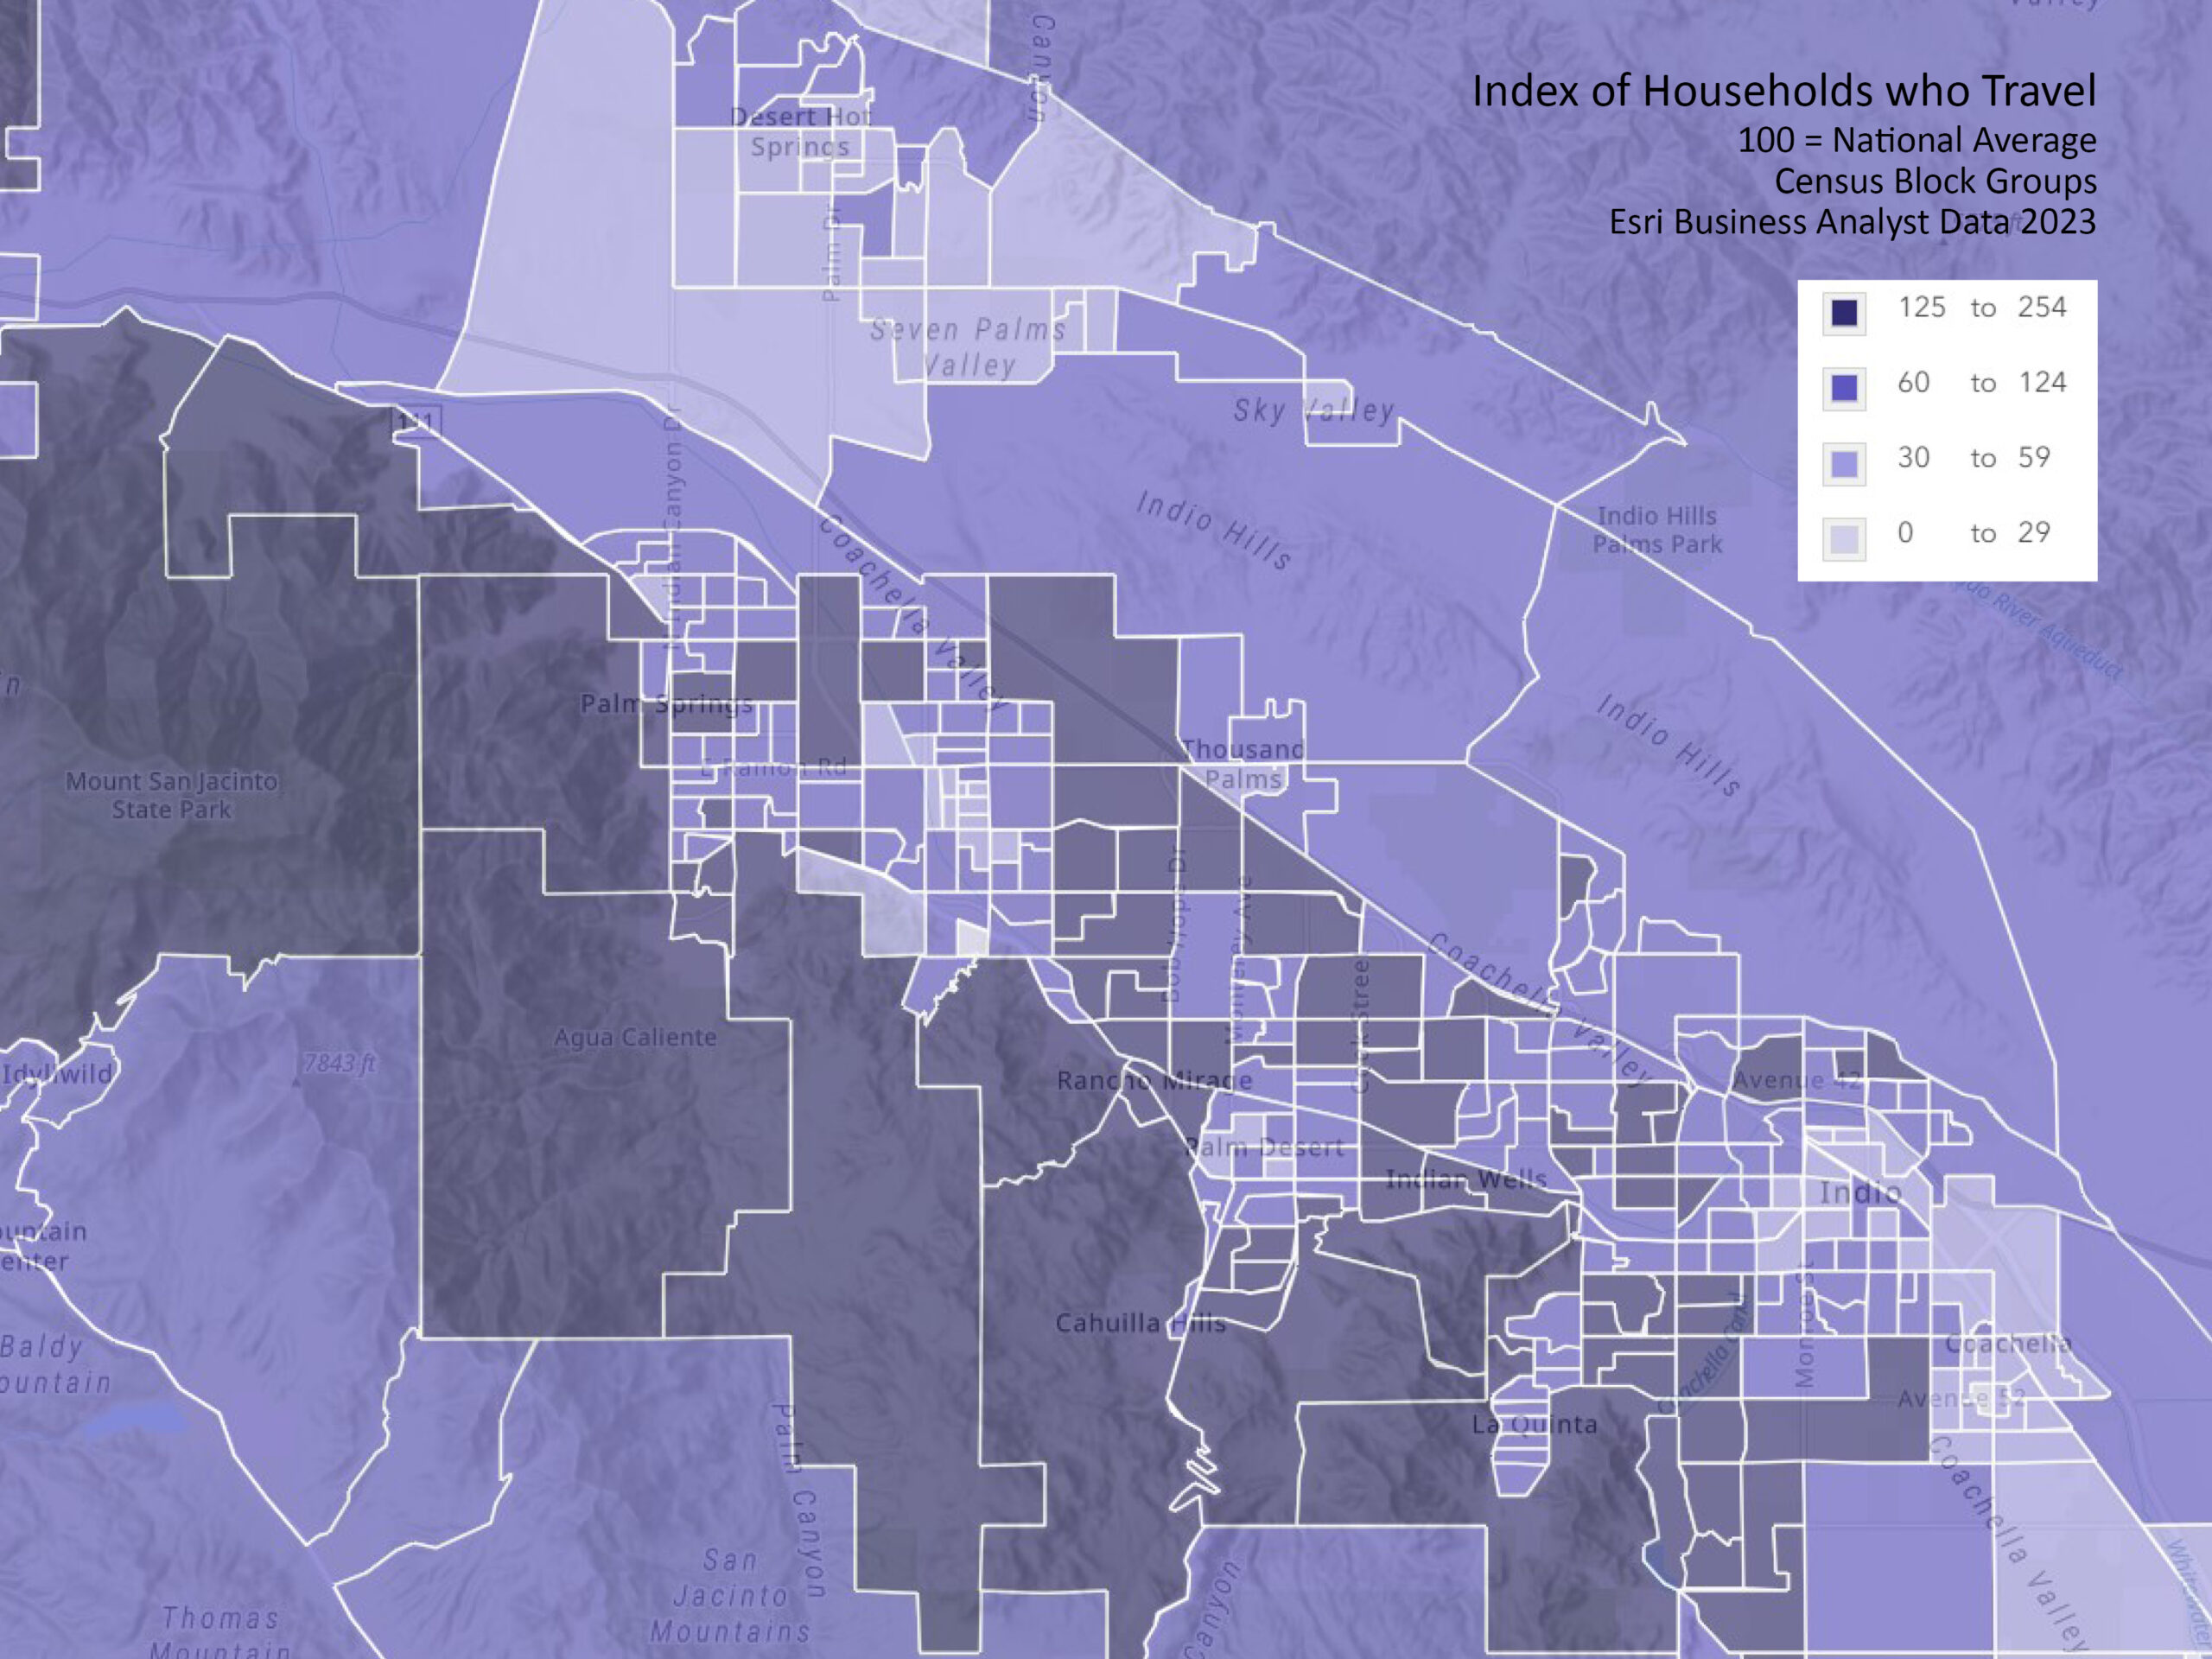
And finally, this map shows where residents who travel more than the national average are concentrated. Here, block groups are mapped by an index. Here, the index is equal to 100, representing the national average. So an area with an index of 125 is 25% more likely to travel than the national average.
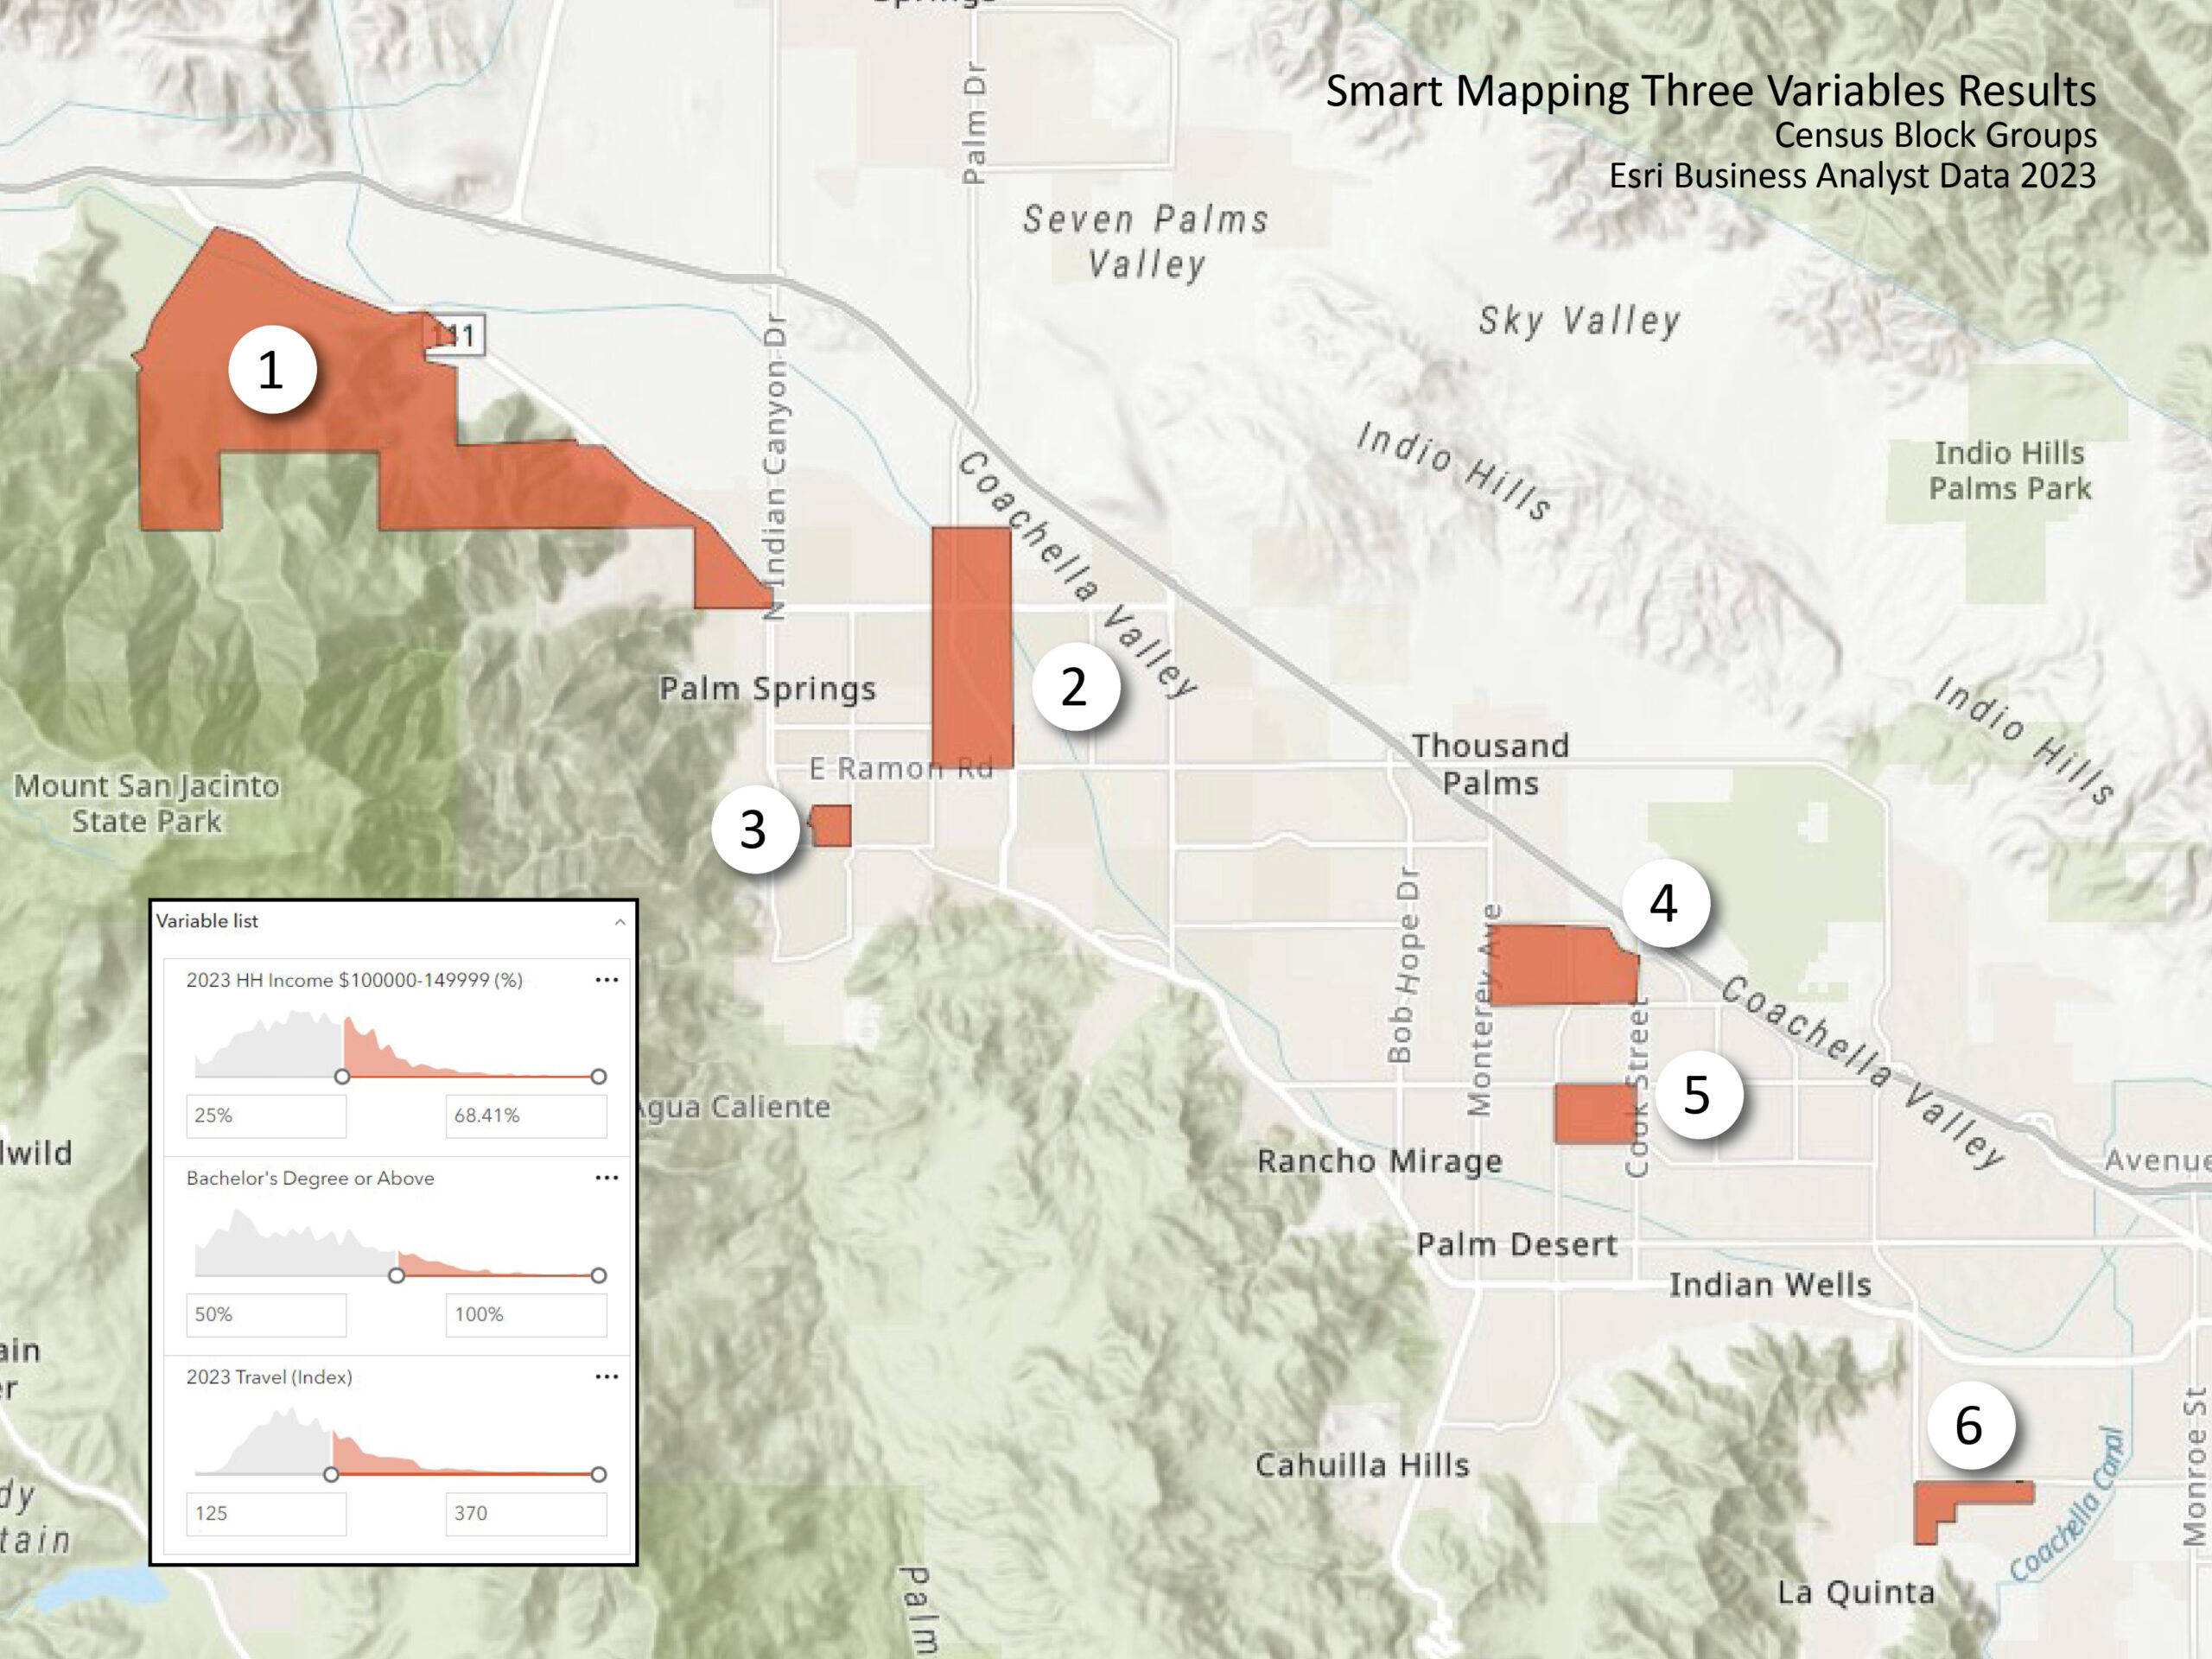
Utilizing Esri’s Business Analyst Online tools, I can overlay each of these customer profile variables and see where the highest instances of these attributes overlap. You see in the variable list sliding scales for each variable. I can move these scales back and forth, pinpointing selected block groups that fulfill the chosen thresholds (in orange). For example, I have set the minimum travel index at 125, meaning I do not want any block groups that score less than a 125 index.
After fine-tuning the thresholds, 6 block groups appear that fulfill my chosen thresholds for the customer variables. Each of the 6 has at least 25% of households with the chosen income variable, 50% or more with at least a bachelor’s degree, and households who travel at least 25% more than the average.
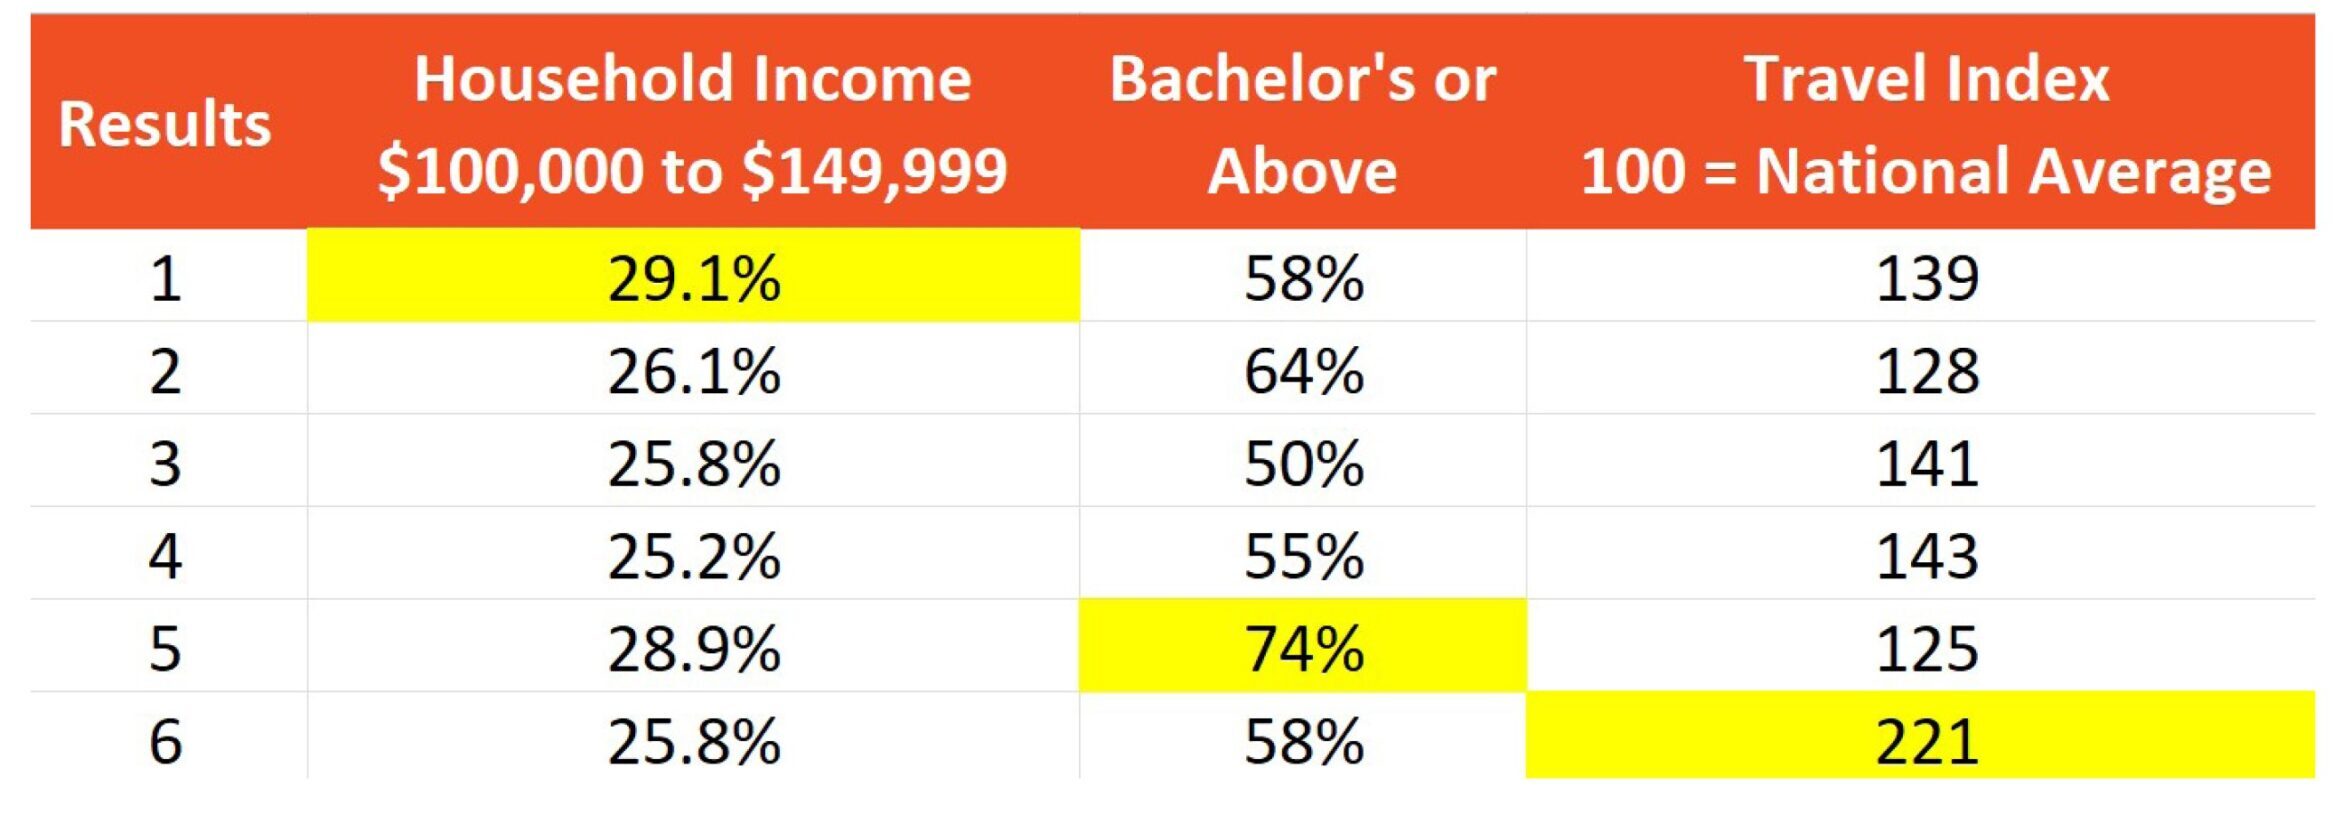
So, out of 334 census block groups, only 6 fit the criteria outlined by the potential business. This allows the business to focus its limited resources on a much smaller geographic area. Maybe they want to do a focused mailing campaign? Maybe they know their potential customers would like to walk to their new establishment, and they could study the walkability of just six sites.


