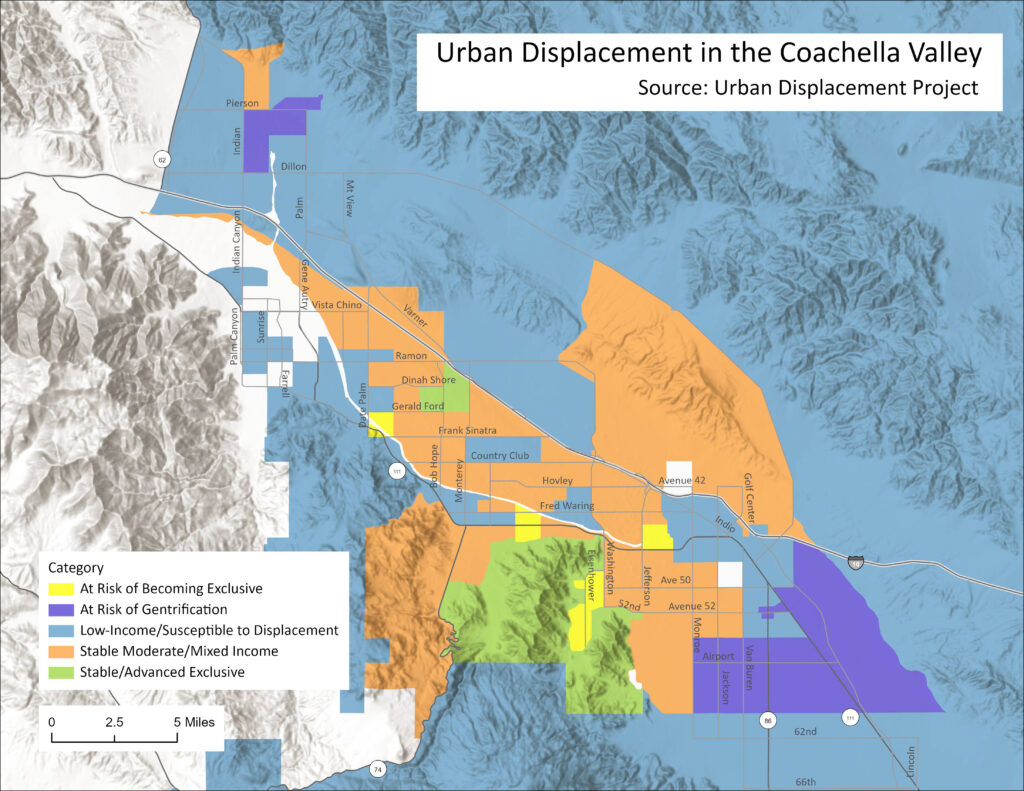
Since the beginning of the pandemic, residential real estate has been on a wild roller coaster ride. Housing prices in the Coachella Valley rose to historic levels during the COVID restrictions. People moved into the valley for comparatively lower-priced homes and less overcrowding, looking for more desirable places to lock down and work from home. And despite the shocks of inflation and considerably higher interest rates, median housing prices in the Coachella Valley have only declined slightly from their recent historical highs. Housing inventory remains very low, and exceedingly low for lower priced housing. Rising property values have led to increased rent and housing costs, forcing many long-term residents to seek alternative accommodations or move away. Today’s map explores the risks of neighborhood change in the Coachella Valley due to residential displacement and possible gentrification brought on by rising housing costs.
Data for this urban displacement map comes from the Urban Displacement Project. They created a theoretical neighborhood change database quantifying attributes of displacement and gentrification. A large set of data was aggregated to create “typologies” of displacement and gentrification. These included household income, availability of low-income housing, changes in housing costs and rental values, and demographic data from the US Census, as well as real estate market data from Zillow. Recent data values from this comprehensive dataset were compared to 2018 values to codify neighborhood change.
These aggregated data were then classified into eight categories of urban displacement and gentrification. This detailed map shows that 5 of the 8 categories can be mapped onto the Coachella Valley representing varying “weights” of possible displacement and gentrification. These categories represent stages of neighborhood change and should not be interpreted that these stages are “predetermined.” Instead, they allow us to see patterns in a region and to start conversations about possible policy interventions and investment in more equitable development.
This map displays four overall neighborhood change dynamics distributed throughout the valley – stability, susceptibility to displacement, gentrification, and exclusivity:
- The orange Stable moderate/mixed-income census tracts are areas where household income was already moderate to high in 2018 and showed little change, meaning that there already was limited housing for low-income households.
- The green Stable/advanced exclusive tracts are where there was already a predominance of housing only affordable to high or mixed high-income households with incomes continuing to rise and low-income household outmigration.
- The light blue Low-Income/Susceptible to Displacement tracts mean there was a sizeable population of low or mixed-low-income households in 2018 but these areas are becoming increasingly unaffordable for this population.
- The dark blue At Risk of Gentrification tracts had a sizeable number of low-income or mixed low-income households in 2018. But increases in rent and housing costs in this are greater than the regional median making housing less and less affordable. And rent gaps (the disparity between the current rental income of a property and the potentially achievable rental income) here are greater than the regional median rent gap. This means there is a strong incentive for landlords to raise rents on their properties.
- The yellow At Risk of Becoming Exclusive tracts are high-income neighborhoods where housing markets are becoming increasingly unattainable to low-income residents.
Vibrant urban areas rely on the amount and density of unique places, neighborhoods, and inhabitants. The Coachella Valley needs to be a place where all are welcome and are allowed to thrive, not just the wealthy. And our local economy depends on a workforce that accommodates all income levels. We recognize the dizzying complexity and disincentives for creating affordable housing, most notably subsidized housing, especially in California. But we encourage our desert cities to work towards a mix of housing that works for every income level and every type of family. Accessibility to housing is a key component of a thriving regional economy.


