

The US Census Bureau has finally released the 2020 redistricting data in a more accessible format. A primary purpose for each decennial census is providing the 50 states, the District of Columbia, and Puerto Rico with population counts to use in their redrawing of congressional and state legislative district boundaries. These data include population and racial/ethnicity counts for incorporated places. Following are tables displaying the 2020 figures for each of our nine incorporated cities. The 2020 numbers are compared with the 2010 Census figures.
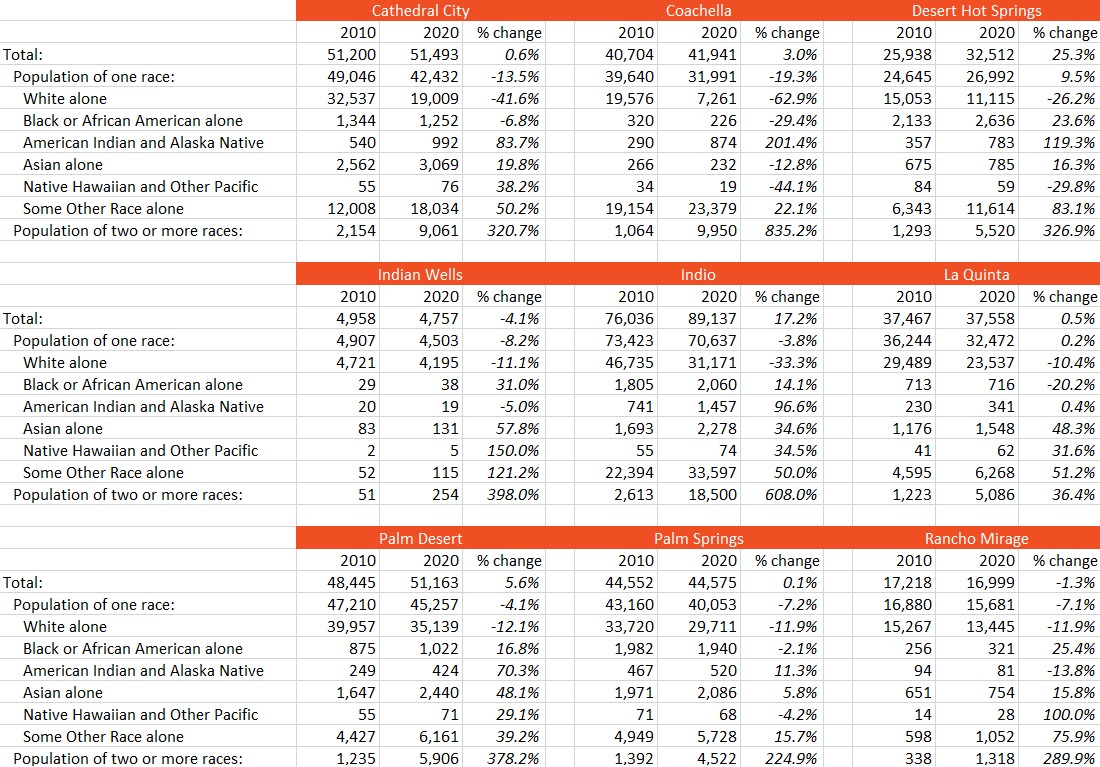
Biggest Changes from 2010 to 2020 Census:
- Total Population: Desert Hot Springs +25.3%
- Population of one race: Desert Hot Springs +9.5%
- Black or African American alone: Indian Wells +31.0%
- American Indian and Alaska Native alone: Coachella +201.4%
- Asian Alone: Indian Wells 57.8%
- Some Other Race alone: Indian Wells 121.2%
- Population of two or more races: Coachella 835.2%
Largest Declines from 2010 to 2020 Census
- Total Population: Indian Wells: -4.1%
- Population of one race: Coachella: -19.3%
- White alone: Coachella: -62.9%
- Black or African American alone: Coachella -29.4%
- American Indian and Alaska Native alone: Rancho Mirage -13.8%
- Asian alone: Coachella -12.8%
Reporting on race/ethnicity has changed significantly in a decade. Census households chose to identify as “population of one race” much less than in 2010 while responding to “population of two or more races” at a much higher rate. This coincided with reporting of “white alone” dropping in all nine cities.
Increases in population in the last decade must also be examined in the context of city boundaries enlarging over time. These two maps show the census boundaries for each of the nine cities for 2010 and 2020. While Desert Hot Springs showed the highest growth also note its expanded boundary during the following decade.
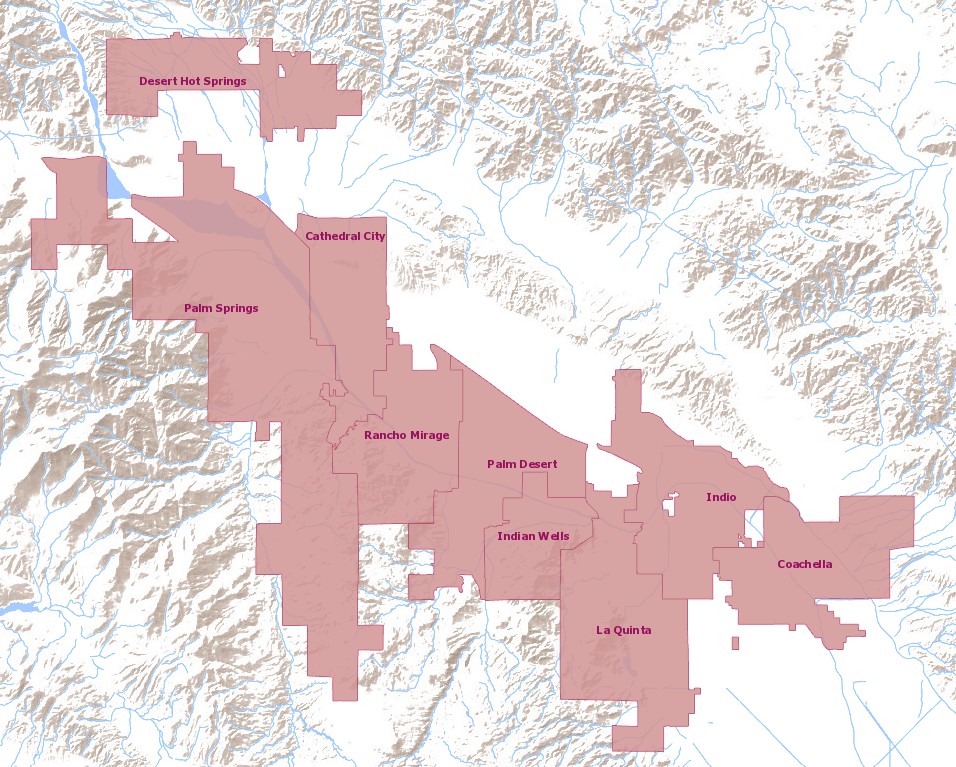
2010 Census Place Boundaries
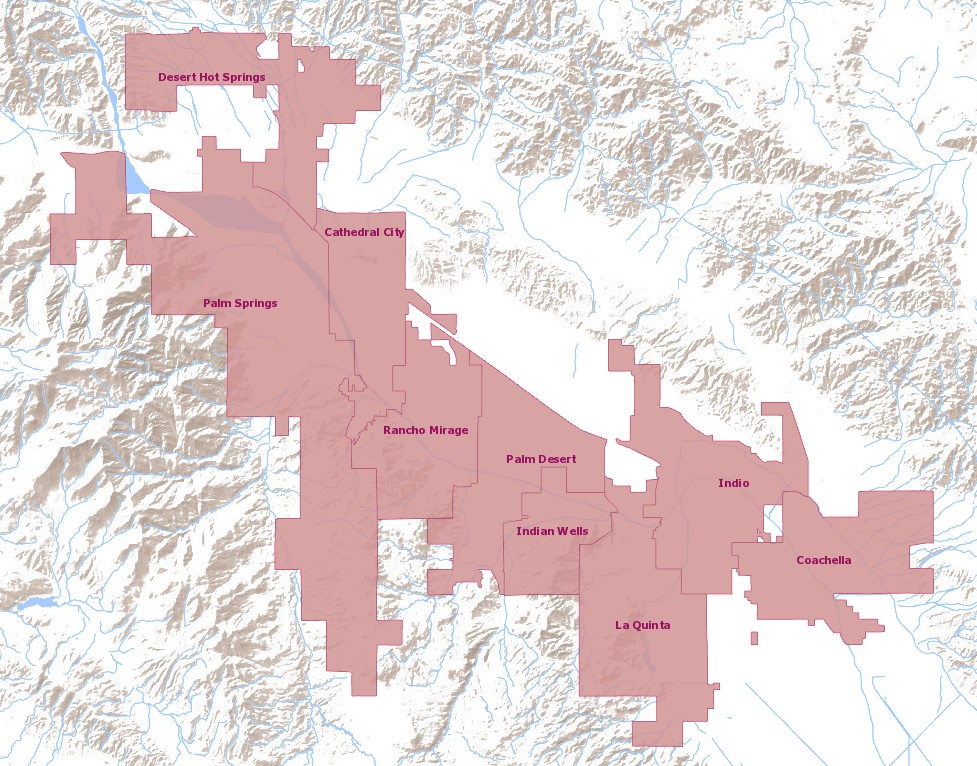
2020 Census Place Boundaries


