
The month of May celebrates Asian American and Pacific Islander Heritage. Every year in May, we recognize the contribution and influence of Asian Americans and Pacific Islander Americans to the achievements, culture, and history of the United States. Today we examine where this population resides throughout the Coachella Valley.
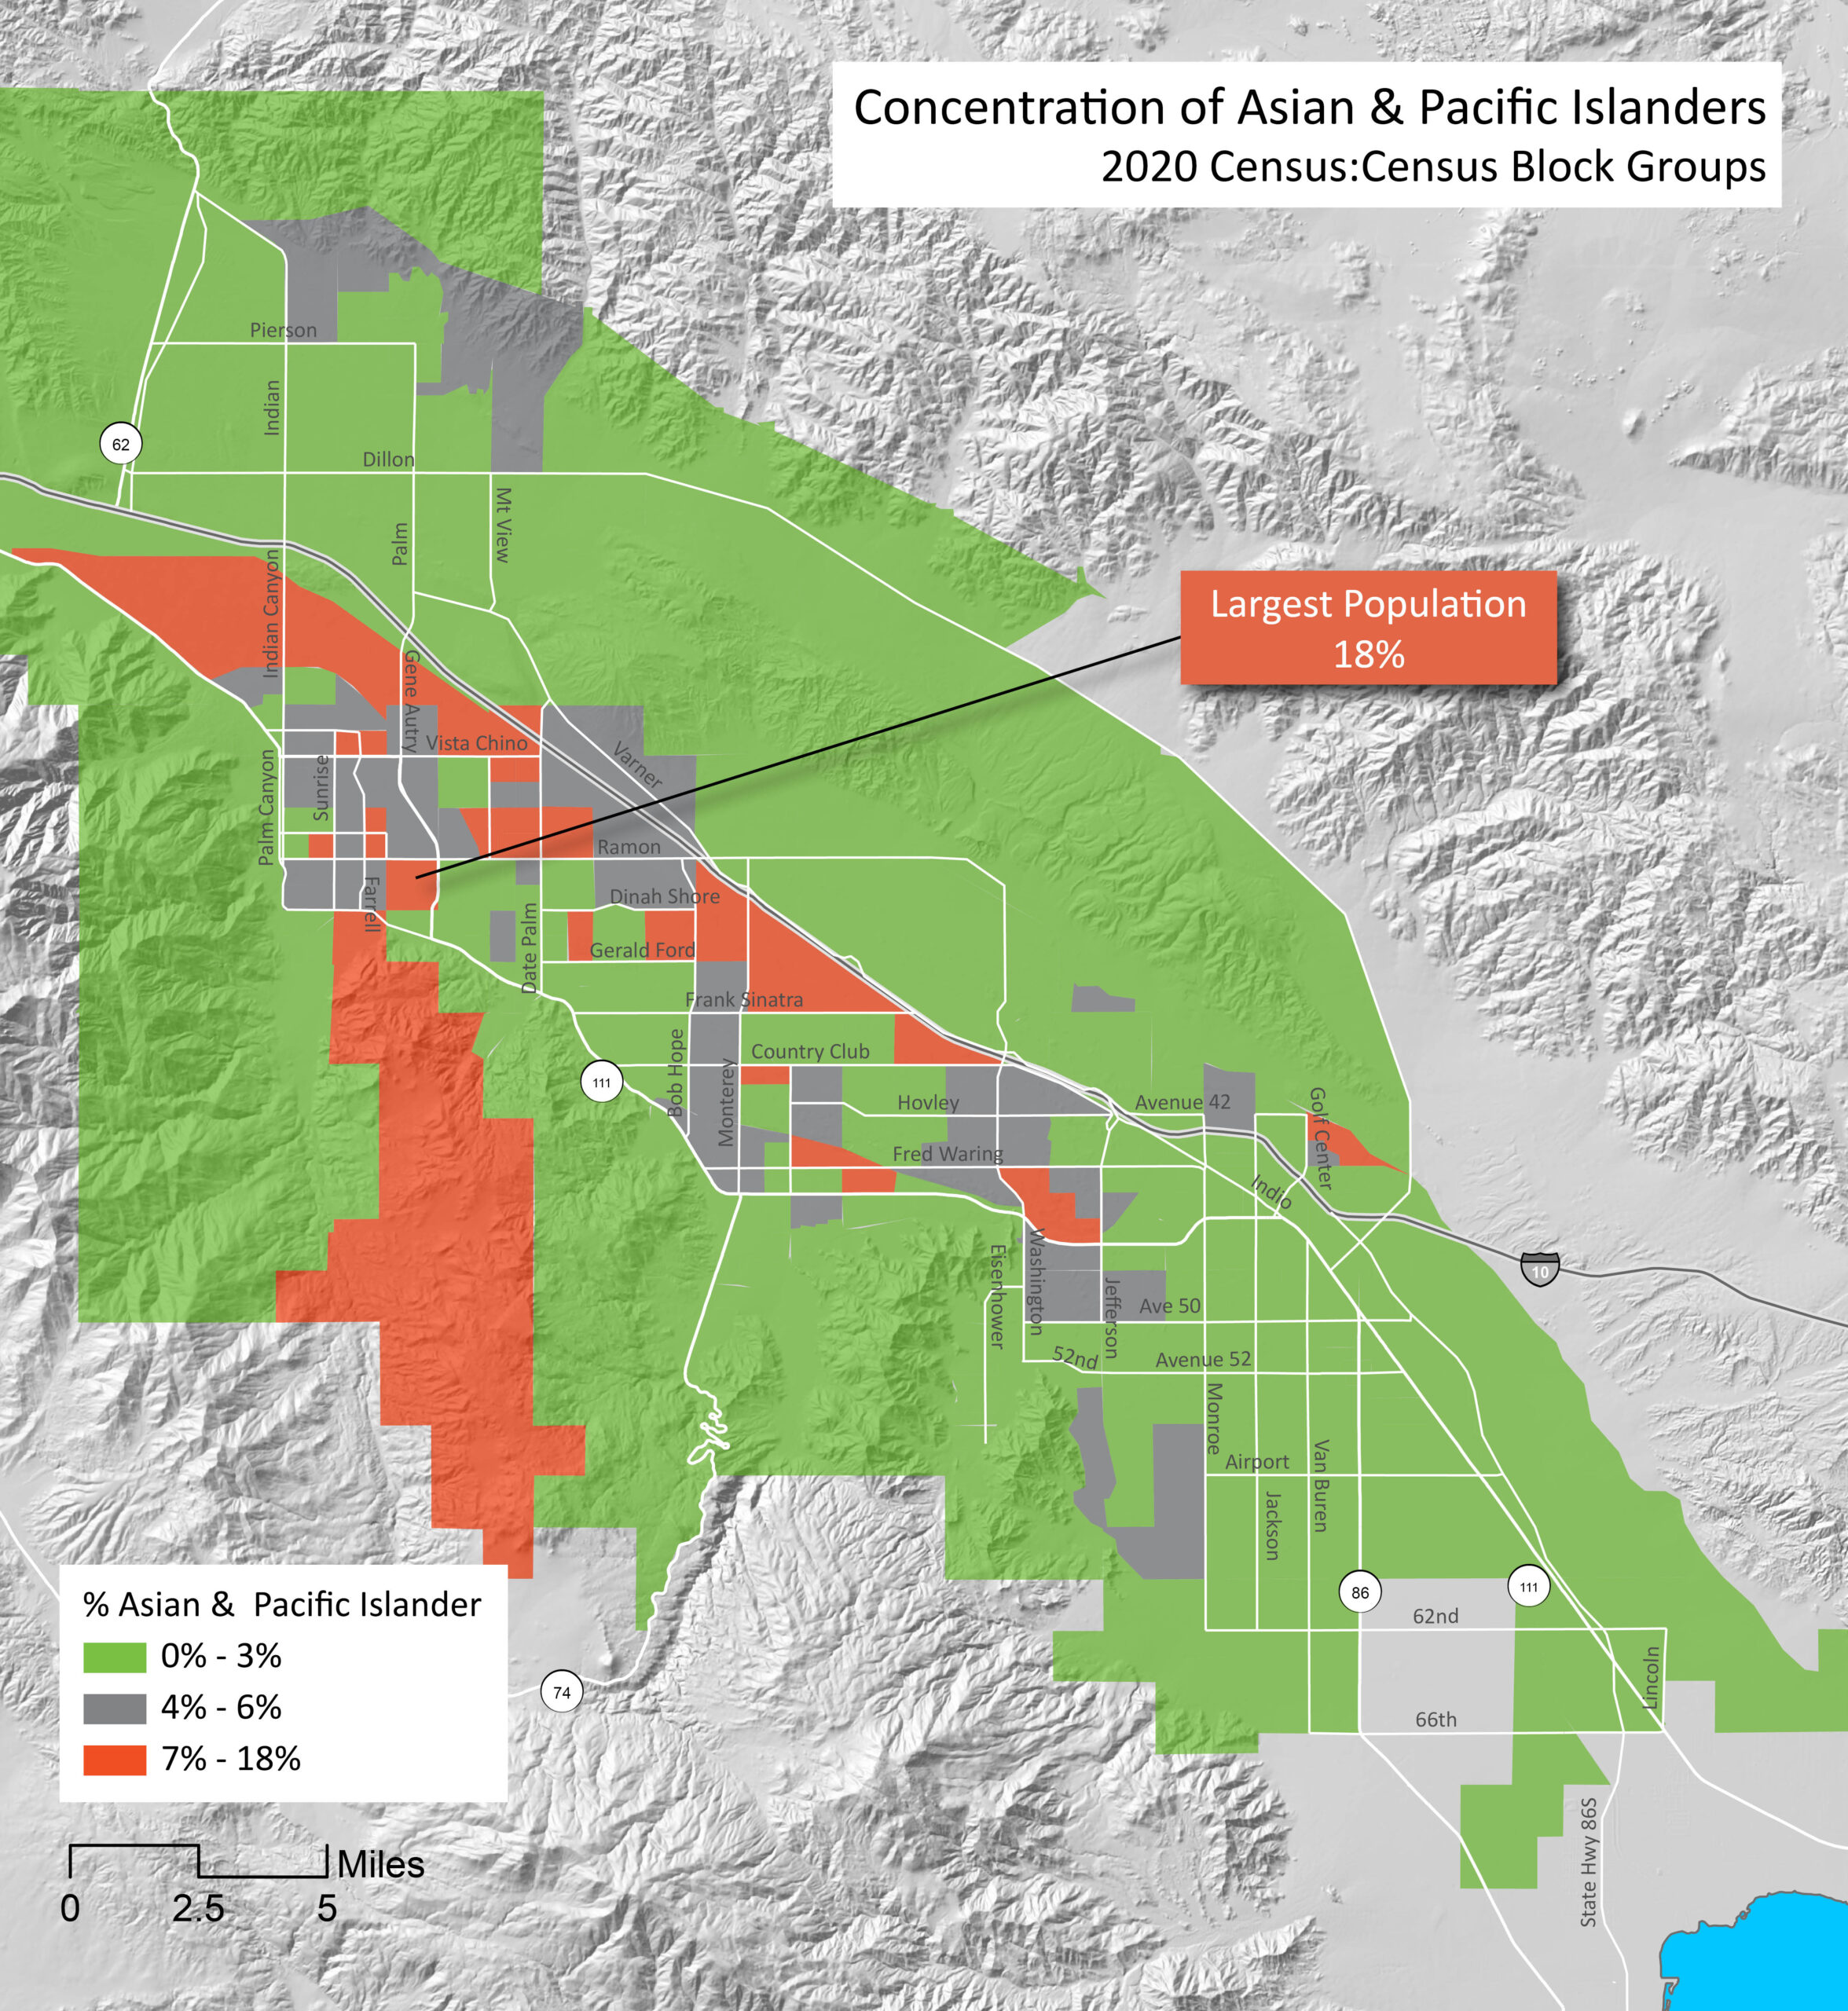
Overall, the Coachella Valley has about half the concentration of Asian and Pacific Islanders as then the whole US, at 3% (represented by the green areas in the map) and 6% respectively. Still, the map shows that this population is distributed all throughout the valley, with block groups of 7 – 18% of the population in just about every valley area. Comparatively, our valley has a little more than half the proportion you find in Riverside County (7%) but well below the 16% of all of California. Between the 2010 and 2020 Census, the valley percentage stayed pretty much the same, but California saw a 3% rise in the proportion of Asian and Pacific Islanders to the overall population.
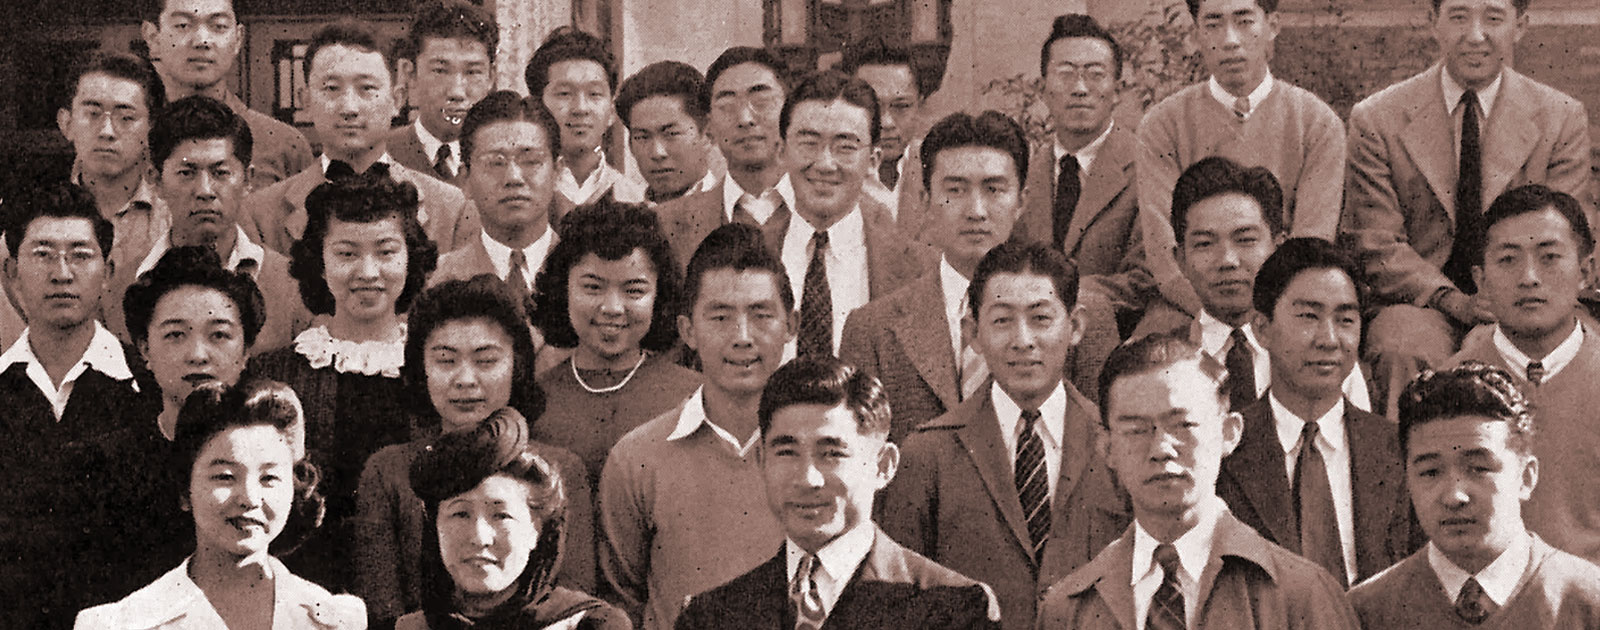
I have a great affinity to this population, as my husband is half Japanese. His father was sansei, born in the Seattle area of immigrant Japanese parents. Just before he was to start his freshman year at the University of Washington, he and his family were sent to an interment camp at Manzanar, CA. They, and their Bainbridge Island community, were the first to be forcibly removed from their rightful homes during World War II.


