
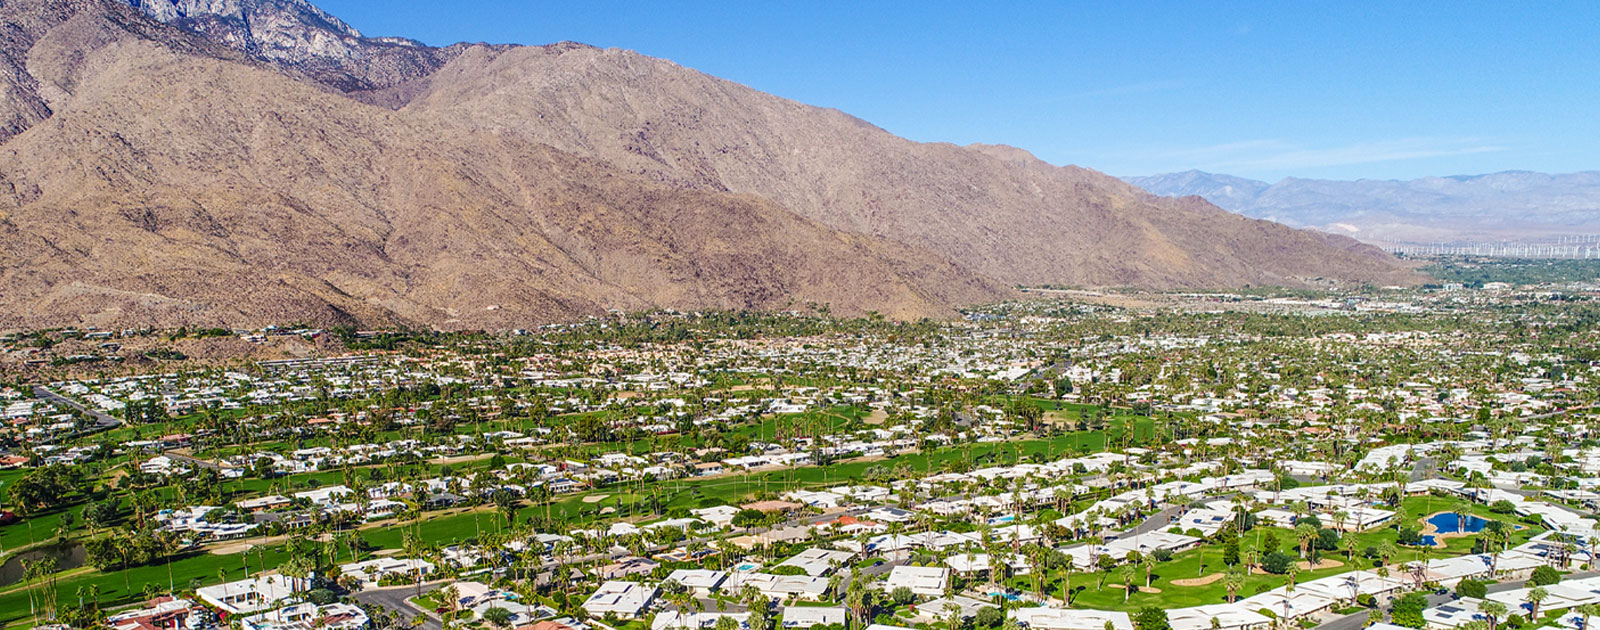
Palm Springs Life’s real estate forecast seminar, Market Watch, is always fascinating, and this week’s presentation was no exception. Any data geek like me can’t get enough of the extensive facts and figures about the Coachella Valley housing market. And during this unprecedented rise in home values, housing data helps make sense of this volatile market. At CVEP, we are especially keen on trying to understand how migration shifts brought on by COVID may be reshaping the valley’s workforce. This week’s Market Watch provided a few clues about these shifts.
Remote-owned vs. Owner-occupied Housing
As most know, a good deal of housing in the Coachella Valley is remotely owned. But in the last three years, that proportion has started to shift. From 2019 to 2022, remote ownership grew by 1,265 units, while owner occupancy grew by 3,343. This coincides with the migration of homeownership from expensive coastal enclaves to more affordable Inland Empire locations, exacerbated by COVID lockdowns and the explosive rise of working from home. And, according to Market Watch, the highest increases in home prices in the Inland Empire are occurring here in the Coachella Valley. This is due to historically low inventory and the desirability of the Coachella Valley as an alternative to the expensive and crowded coastal cities.
Buyers are relocating to larger, more affordable homes with enough room for offices, home gyms, or extra bedrooms. This has made the Coachella Valley such a hot market. From 2019 to 2022, 604 attached homes were built here, while 4,004 single-family residences were built. Despite this, housing sale inventory is still at historic lows, averaging around 700 units now, versus approximately 3500 in 2019. That’s why we have seen the median price of valley detached homes rise over 20% since this time last year.
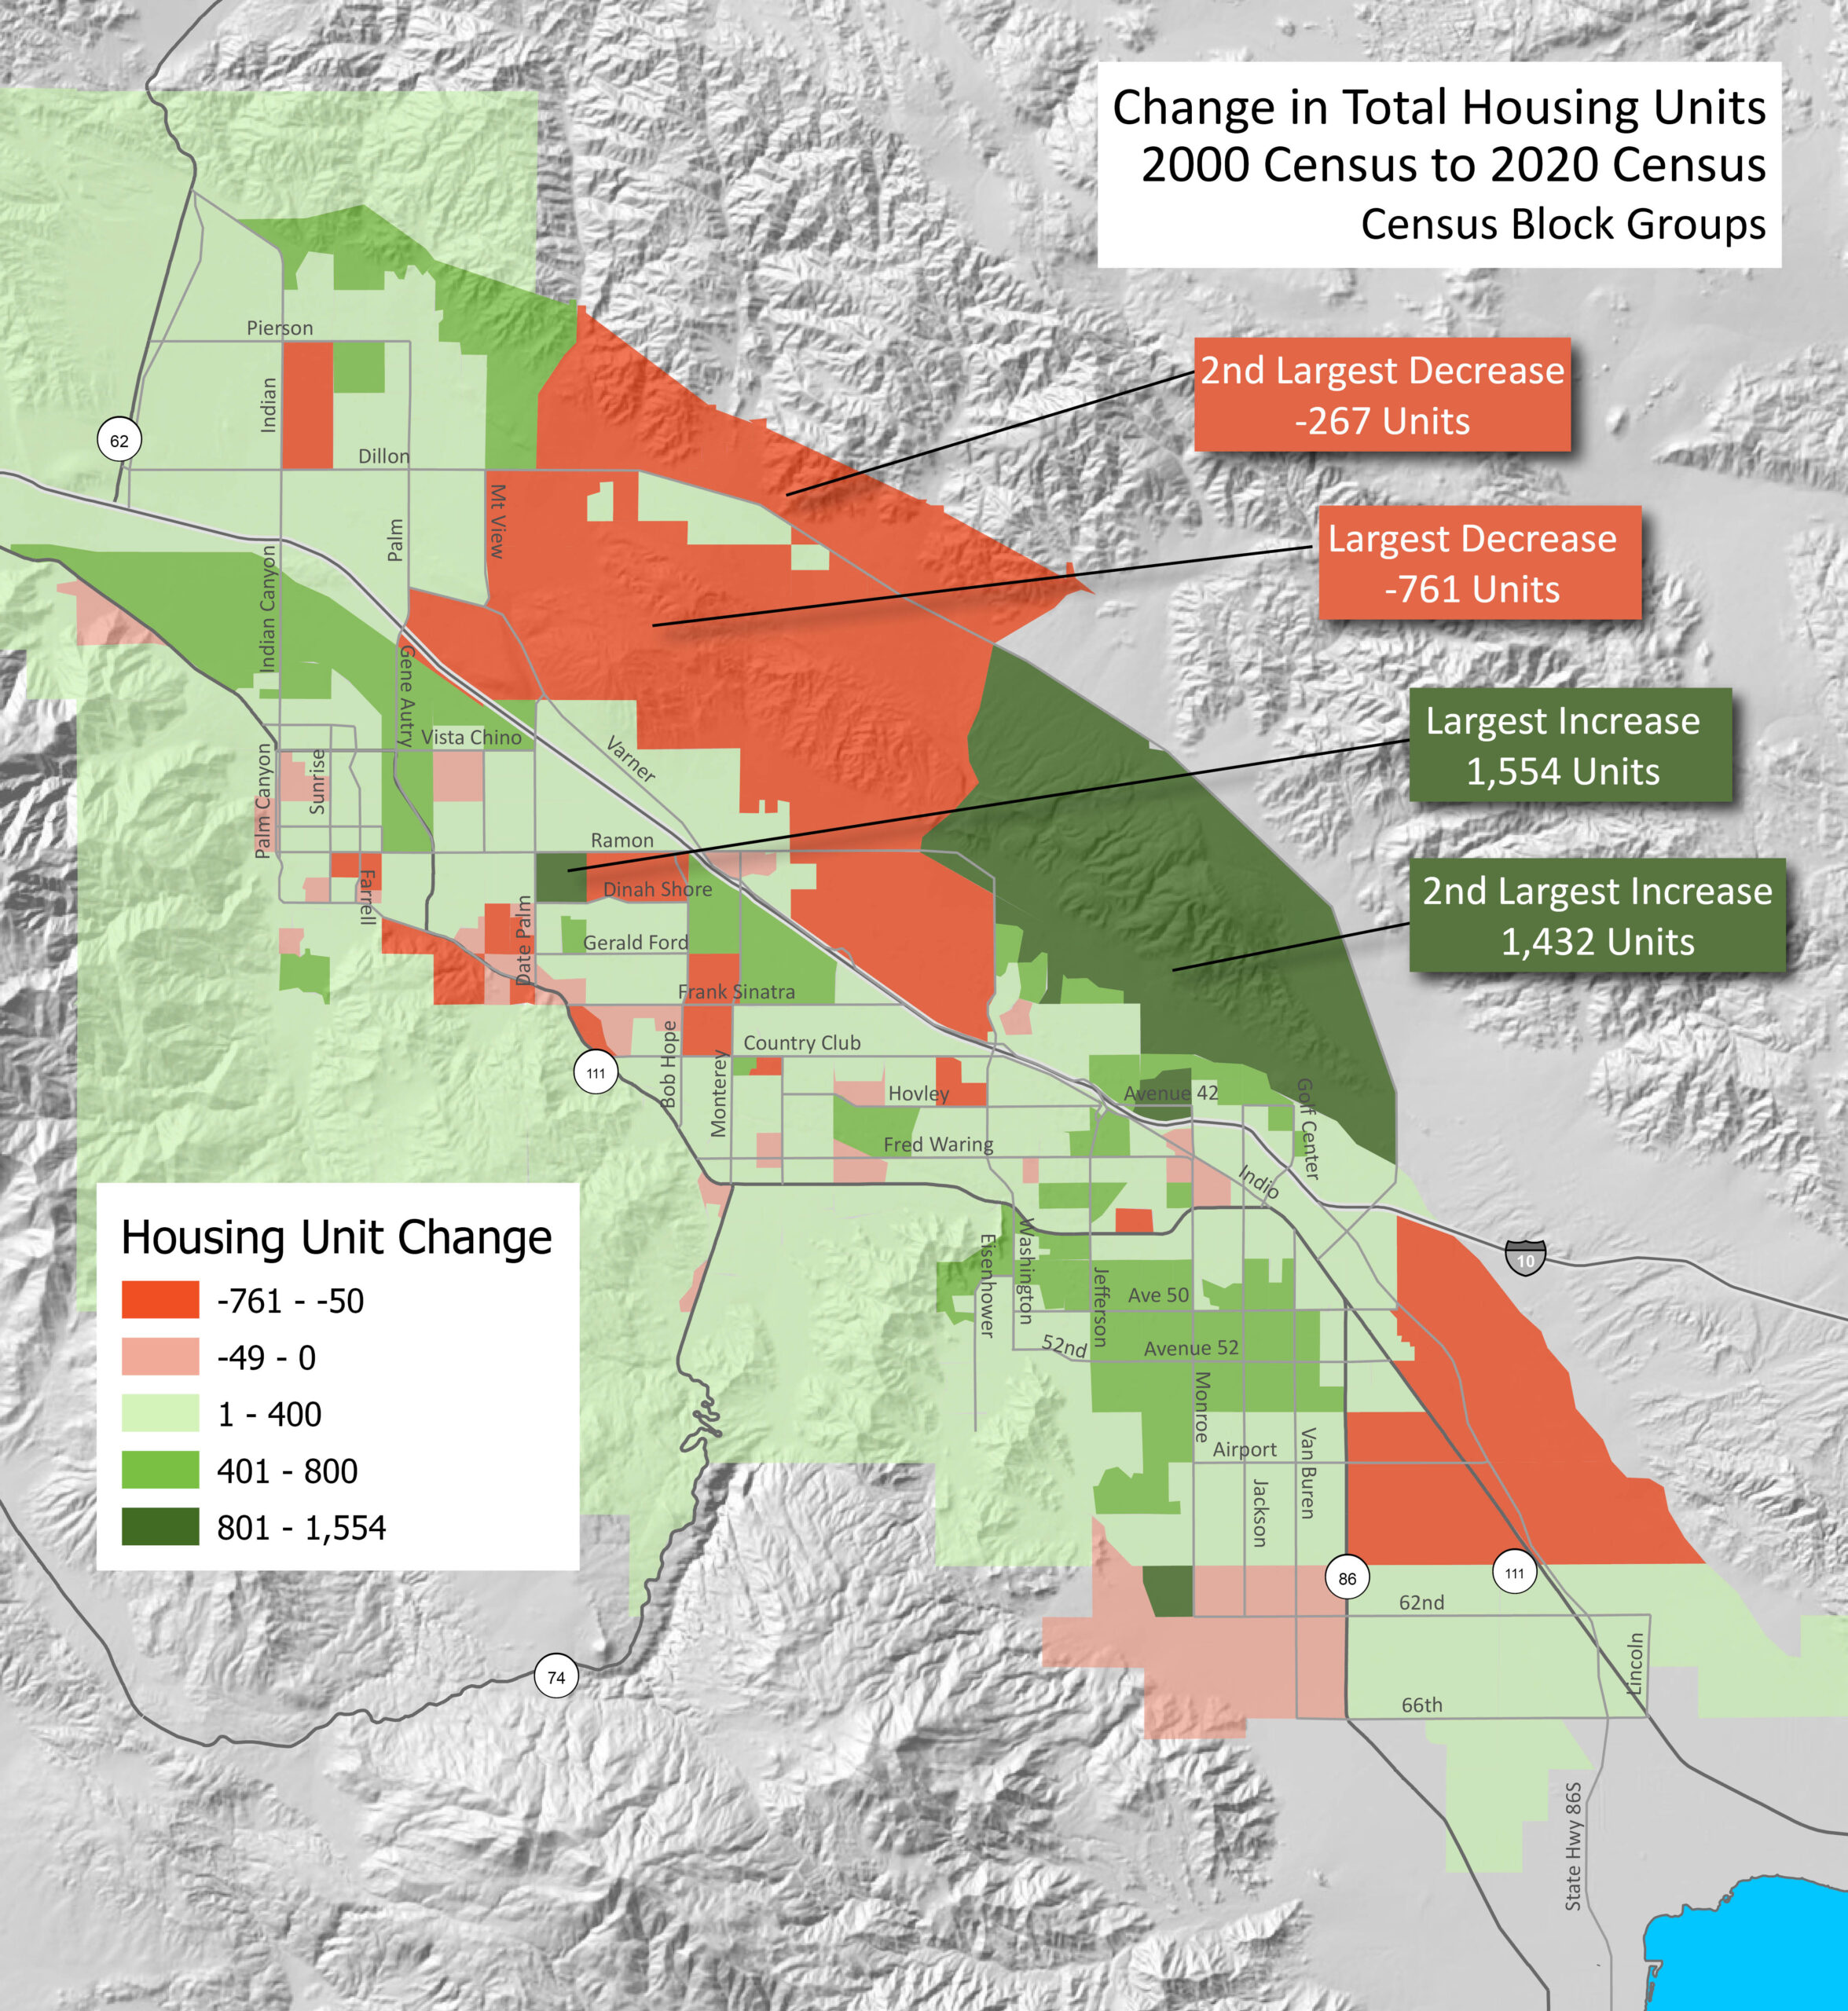
Today’s map shows the change in total housing units reported on the 2000 Census to the recently reported 2020 Census results. I have mapped these values at the Census Block Group level (the second to smallest Census geography) to emphasize that increases and decreases in the last 2 decades have occurred all throughout the valley. Of course, much changed from 2020 until now, with much of the explosive appreciation happening in the last 2 years. And Census Block groups are sized for relatively consistent population counts, not for consistent land areas. So, some of the large changes are attributed to the large land area of the block group.
However, overall, demand far outweighs supply. In-migration of high-income knowledge workers helps diversify our economy. It also encourages the perception that the valley is a wonderful place to live, not just visit. Of course, the meteoric rise in home values, and subsequent rent, is a huge challenge for our current workforce. So, we can’t just concentrate on building homes for those wealthy enough to relocate.


