
Inevitably, CVEP has seen its fair share of climate change conversations. But despite differences of opinions or passions, discussions often turn to “what should we do about potential consequences?” A word repeated often is resilience. How do we create a more resilient valley? Hurricane Hilary reminded us that unexpected challenges will occur. How can we best prepare for them? Today’s web map presents a way for us to look at who is most vulnerable in our valley to climate challenges.
Click here to explore the web map
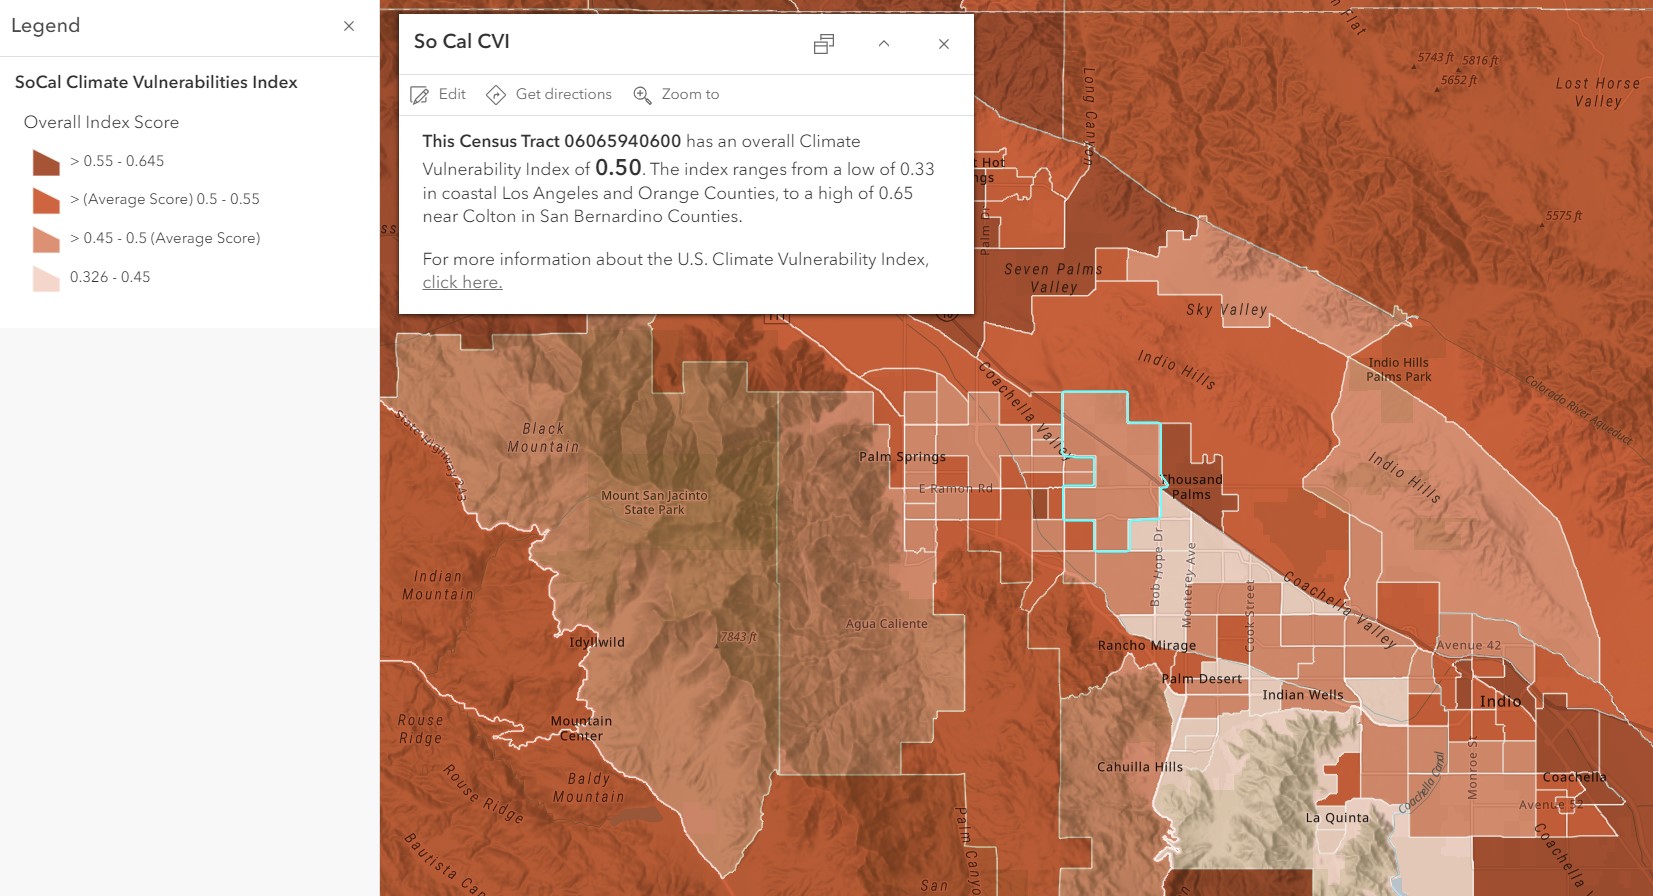
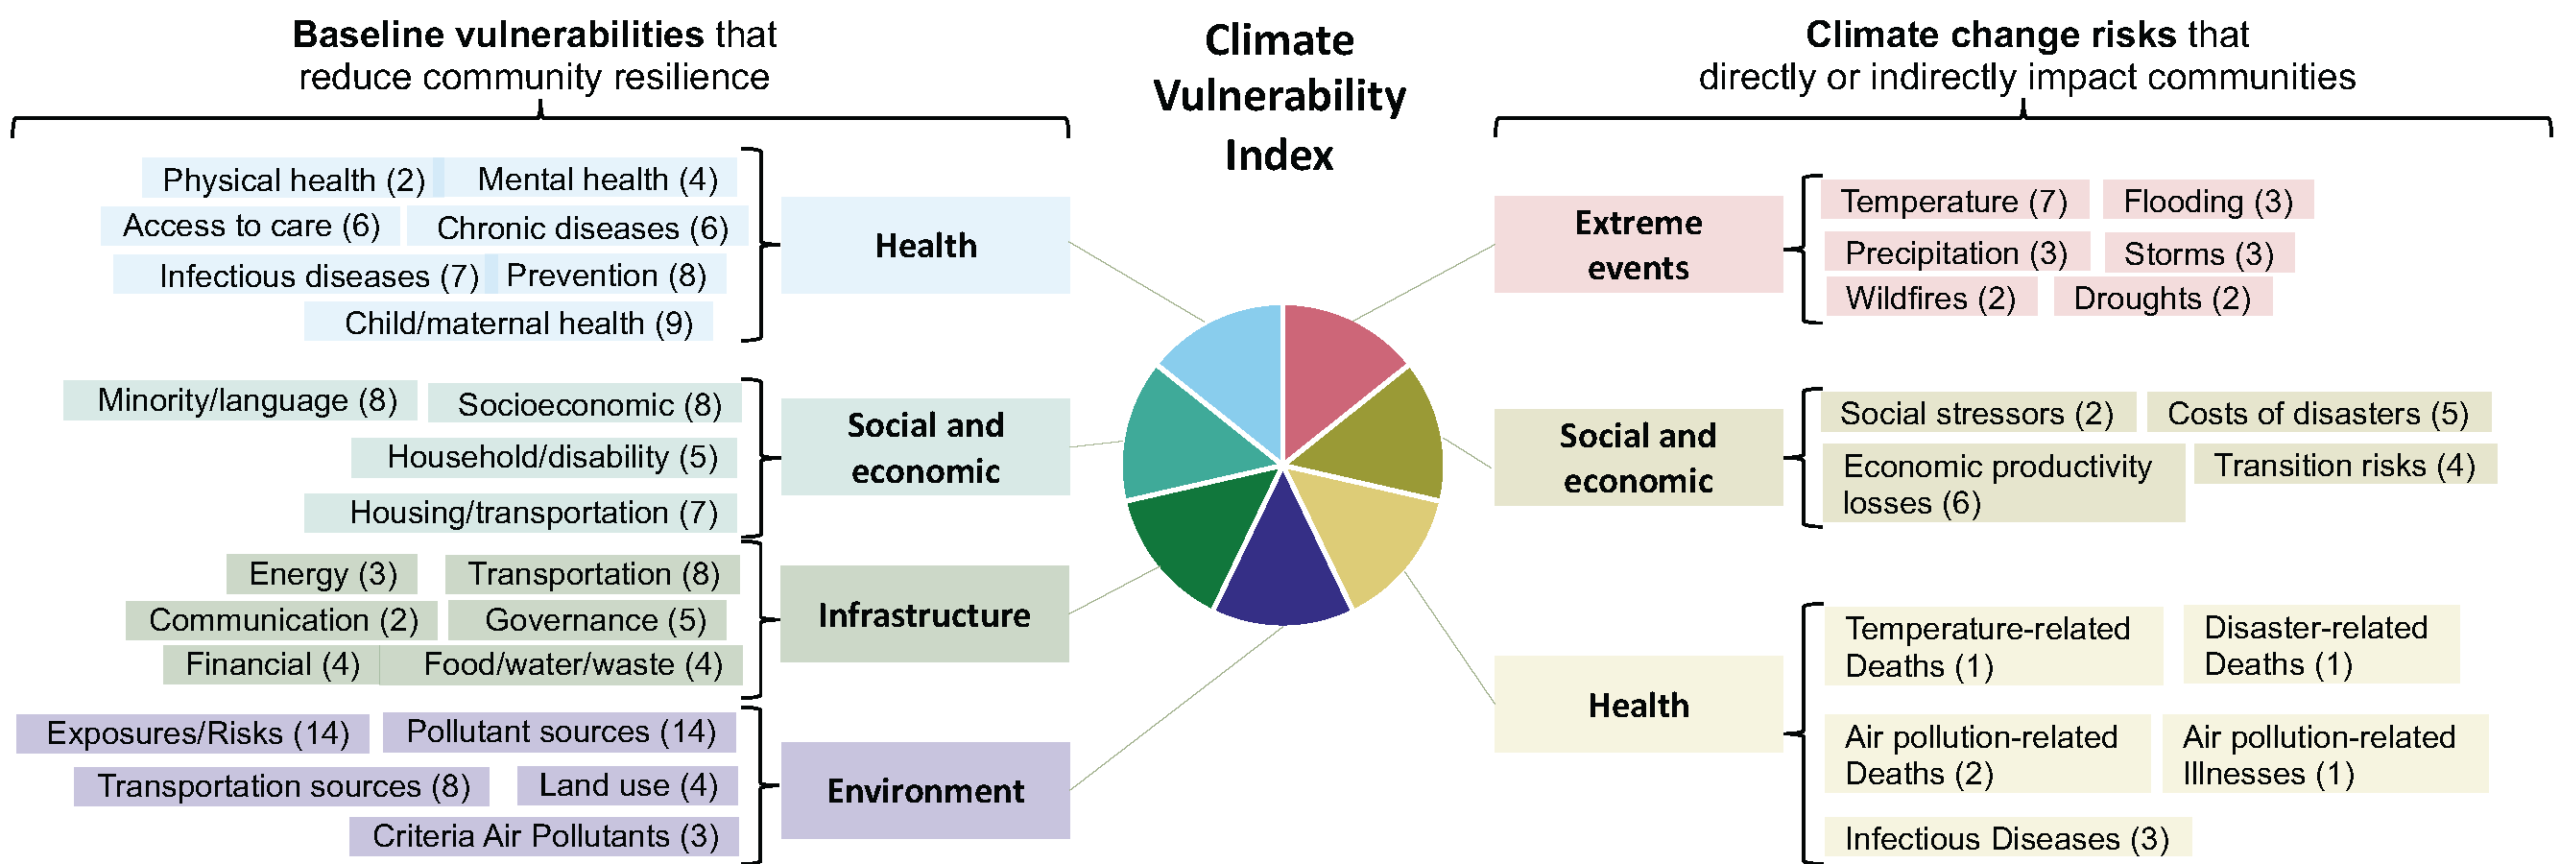
Color-coded census tracts show a composite index score for climate vulnerability. The darkest areas represent the most vulnerable populations. The Environmental Defense Fund and several other national partners developed the Climate Vulnerability Index. The index is built around two main themes: baseline community vulnerabilities and climate change risks. Baseline vulnerabilities include health, social and economic, infrastructure, and environmental data. Climate change risks include extreme events, social and economic, and health risks related to potential climate change. For more information about the index methodology, click here.
Source: https://climatevulnerabilityindex.org/
This graphic from the Climate Vulnerability Index resources web page shows the wide-ranging data used to calculate an overall climate vulnerability index score.
CVEP’s work is about transformation and possibility. Climate vulnerabilities evolve into resilience when we look for unforeseen solutions and opportunities in challenges. Our valley’s desert climate and unique geography are a perfect study ground for addressing climate challenges.


