

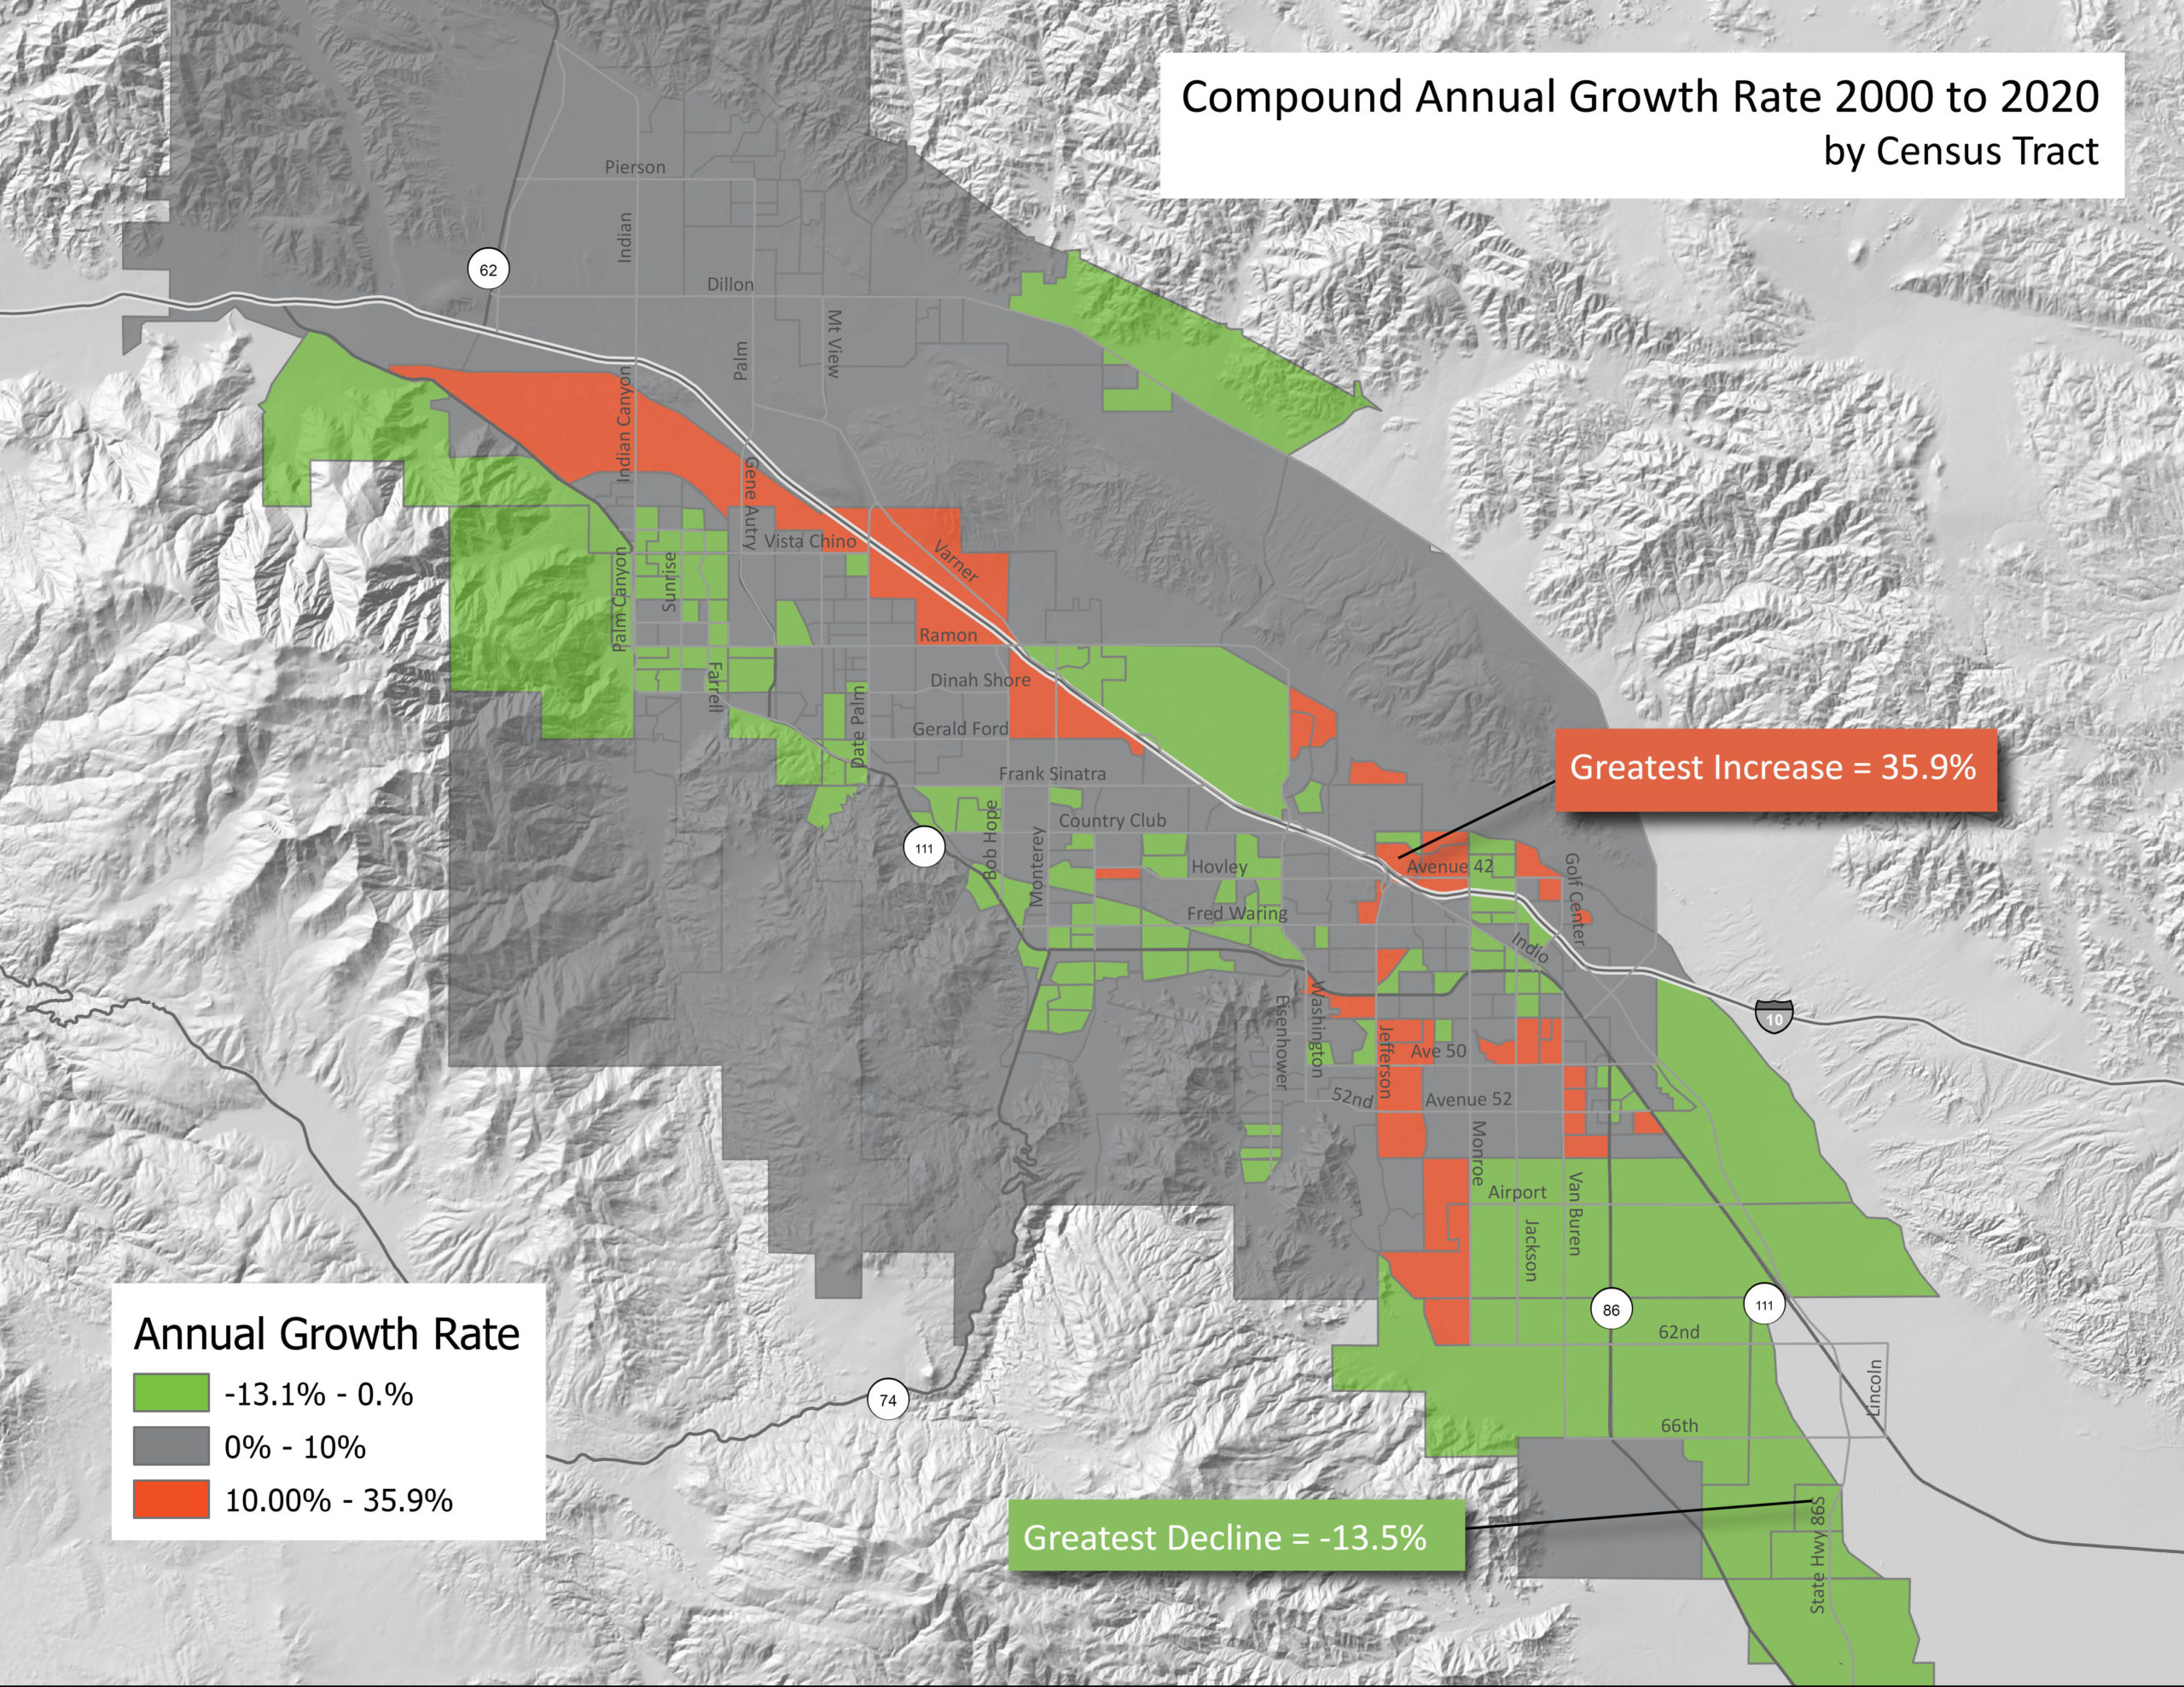
Last week we examined a graph displaying the annual population growth rate from 1990 to 2021. Today we look at these data in maps. The first map shows the compound annual growth rates for Coachella Valley census block groups from 2000 to 2020 (utilizing the latest 2020 Census data). This rate represents a kind of average growth for each year between 2000 to the present. First, the difference in total population between the year 2000 and the year 2020 is computed. Then an equal annual rate is computed to approximate an equal amount of growth for each year that results in the total population growth (or decline).
On closer examination of the map, one sees that population decline most often occurred along the 111 corridor or in the lesser populated areas of the southeast valley. By contrast, the greatest growth occurred along the I-10 corridor, and in the more populated areas of the east valley.
For our next national election, the Coachella Valley will vote in two separate districts. The previous two blogs explained how this bifurcation occurred. Today’s more granular look at population growth in the Coachella Valley reinforces this inevitability. The compound annual growth rate for the Coachella Valley from 2000 to 2020 was 1.65% compared to 0.84% in the whole USA and 0.78% in California. So, while California lost a US Representative after the last census, the Coachella Valley gained one. You can see from the map below Southern California zip codes with growth above the US average, and ones equal to or greater than the CV rate. It is easy to see with all the growth in Riverside County and the Coachella Valley how Congressional Districts had to be reapportioned.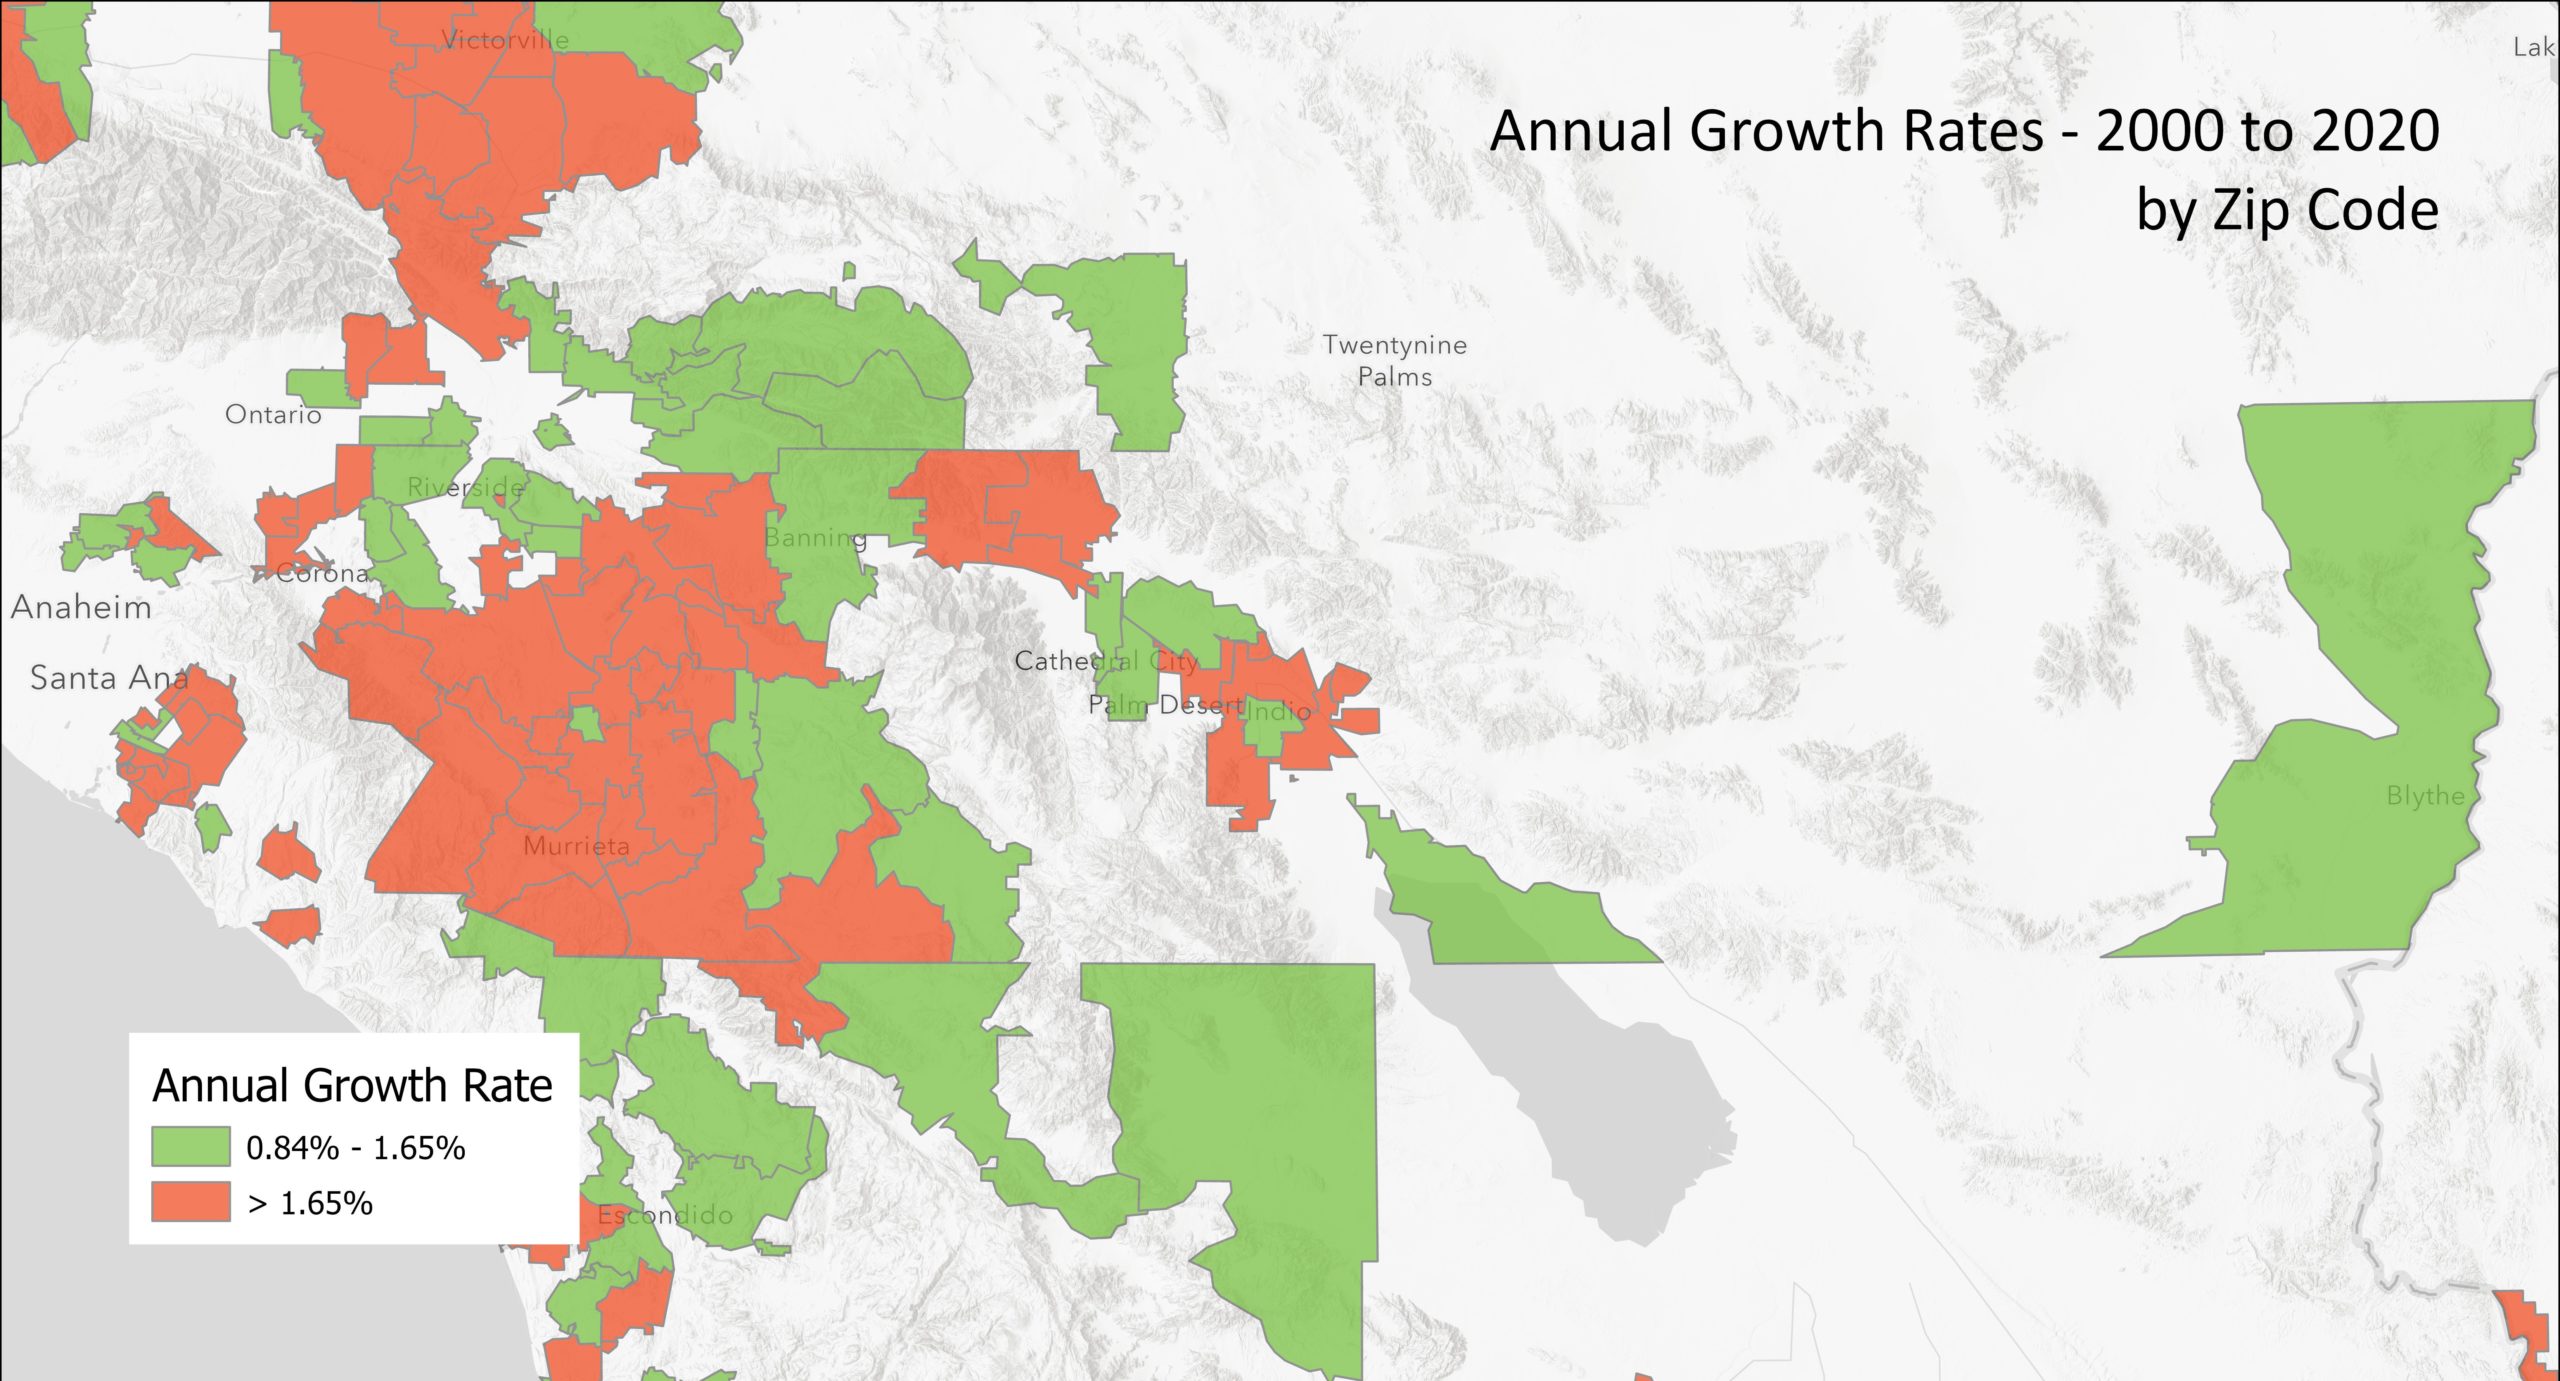


