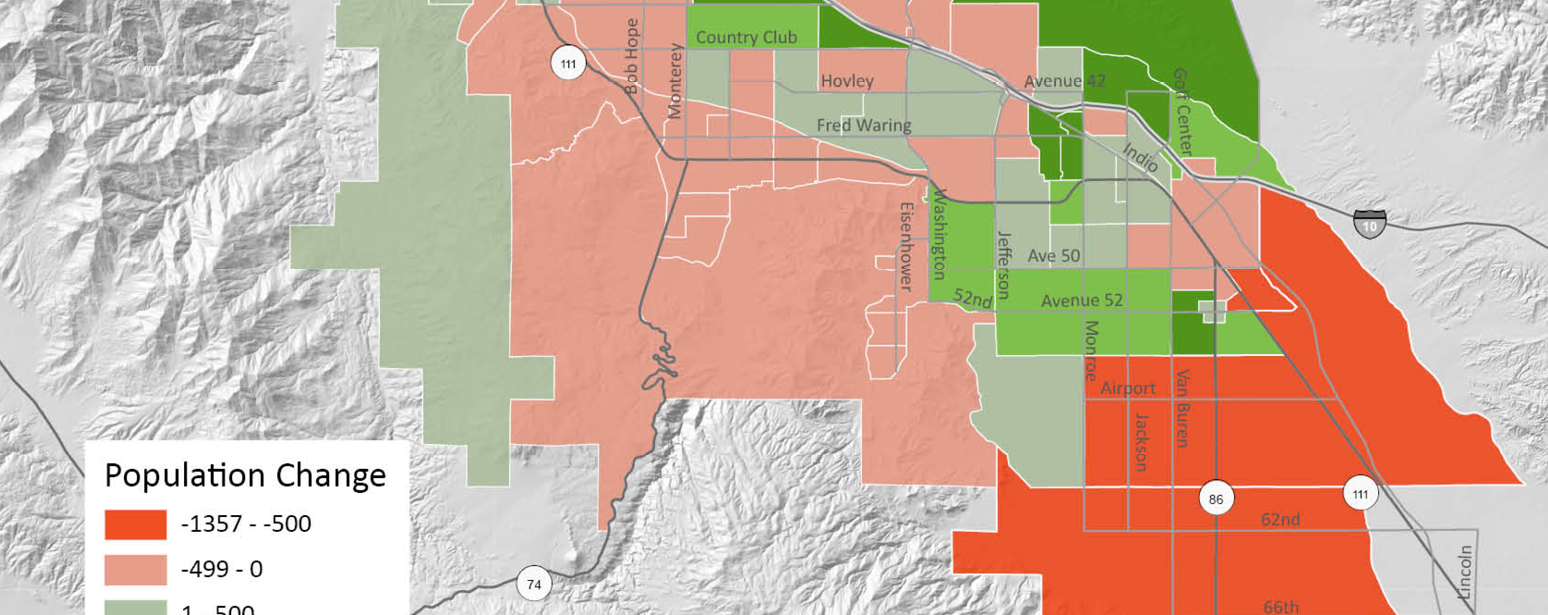
1950 Census – Coachella Valley Population

By |2022-04-19T16:05:55-07:00April 19th, 2022|Categories: Data Digest|Tags: , |

It wasn’t April fools! On April 1 the US Census Bureau released 1950 Census records. After 72 years have passed, the Census releases all answers to previously secret census forms. These handwritten forms are now available for historians and curious relatives to explore. That made us wonder. What did the Coachella Valley look like at [...]

Population under 18 years old: The Distribution in the Coachella Valley

By |2022-03-16T09:08:30-07:00March 15th, 2022|Categories: Data Digest|Tags: , , , |

For today’s Data Digest, we take another look at some of the limited data that is currently available from the 2020 Census. We will start to see more data rolling out this summer. You can count on seeing that discussed in the Data Digest. This week we look at the distribution of residents in the [...]

Coachella Valley Annual Population Growth Mapped – 2000 to 2020

By |2022-01-18T17:45:59-08:00January 18th, 2022|Categories: Data Digest|Tags: , , |

Last week we examined a graph displaying the annual population growth rate from 1990 to 2021. Today we look at these data in maps. The first map shows the compound annual growth rates for Coachella Valley census block groups from 2000 to 2020 (utilizing the latest 2020 Census data). This rate represents a kind of [...]

2020 Census: Census Tract Population Change

By |2021-11-18T18:13:43-08:00November 18th, 2021|Categories: Data Digest|Tags: , , , |

Today I write this blog in honor of this morning's big event, our annual Economic Summit. The 17th Annual Greater Palm Springs Summit took place this morning at 9 am. You can still catch the proceedings here.  The theme was "Pursuit."  Our featured speakers discussed the central theme of a committed regional strategy for coming [...]

2020 Census: Population Change by City

By |2021-11-16T14:23:30-08:00November 16th, 2021|Categories: Data Digest|Tags: , , |

We continue our exploration of the 2020 Census population counts. Here we look at the change in population in the nine Coachella Valley cities from the 2010 census to the 2020 census. Overall, the combined nine Coachella Valley cities saw a 6.8% increase in population. Desert Hot Springs saw the highest increase, 25.3%, with Indio [...]

Go to Top