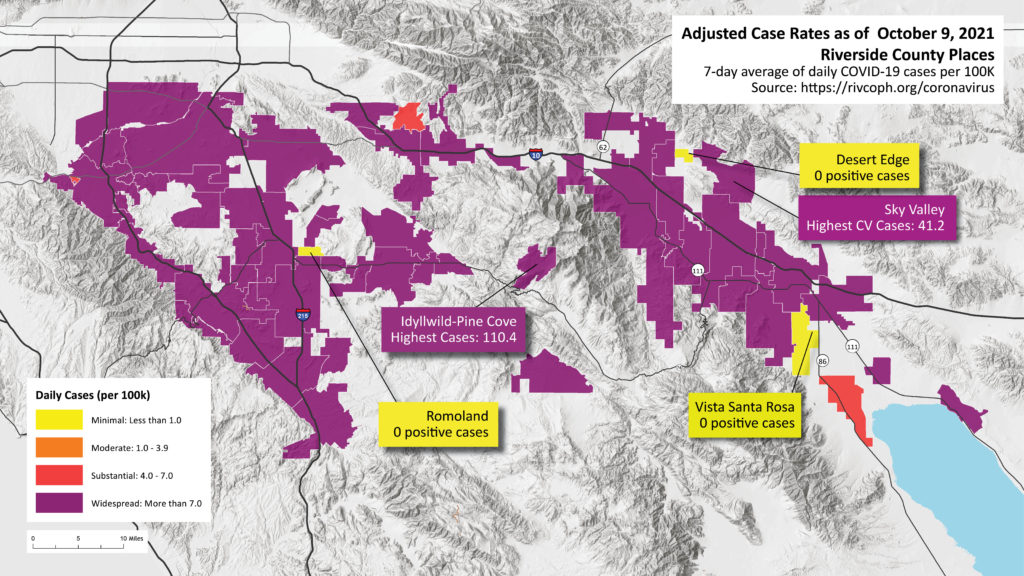
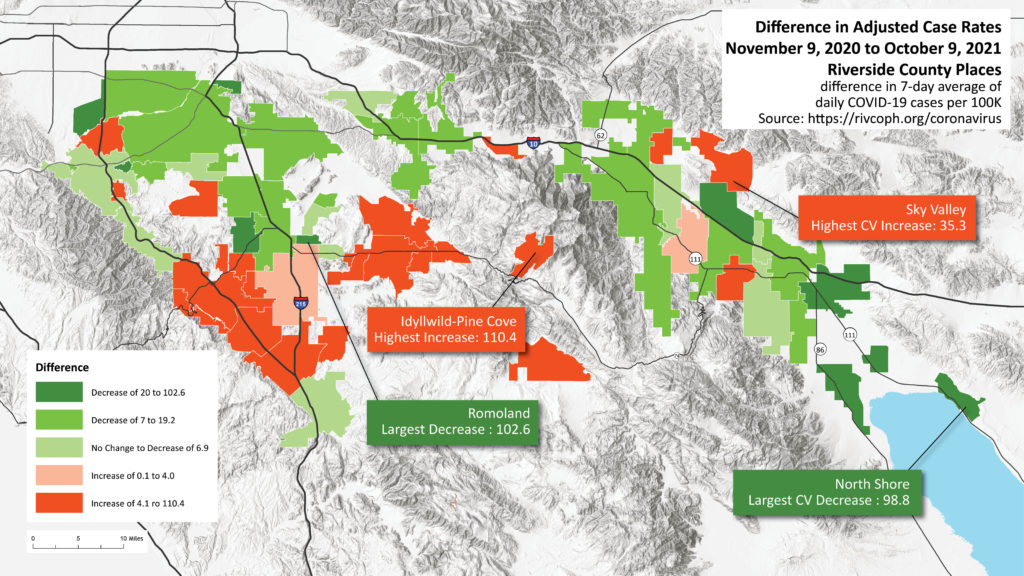
This time of year is bustling at CVEP as we prepare for our annual Summit. Last year, as we entered our 8th month of COVID lockdowns, we had to switch gears and host a virtual summit. Back then we never would have believed that a new variant – Delta, would emerge and return us to high levels of COVID cases. Alas, this year’s Summit is virtual as well. Today we look at the current adjusted case rates and how they compare with this time last year.
In June, California retired its color-coded county reopening tiers. But the map below shows what current adjusted covid rates (the 7-day average of daily positive COVID-19 cases) would look like in the retired tier system. Not that different. The highly contagious Delta variant and Riverside County’s comparatively lower vaccination rates translate into continuing high rates of positive cases. Many of the populated places in Riverside County remain in the widespread category of 10 cases or more in a 7-day average.
The next map shows the difference in adjusted rates between November 9, 2020, and October 9, 2021. You can see great variability across the county. A relatively equal distribution of decreases and increases of cases exists. But the Coachella Valley fares pretty well. Most populated areas here have seen decreases in rates over this time. Only Indian Wells, Sky Valley, and Garnet showed increases. And East Valley communities and Thousand Palms showed the largest declines in adjusted rates.


