

In my previous post, I compared three years of taxable sales in the 9 Coachella Valley cities to glimpse the effects of COVID-19 on local business revenue. But I only reported sales for all business outlets and a subset of retail and food services. The California Department of Tax and Fee Administration also provides sales data categorized by 10 business sectors, e.g., home furnishings and appliance stores.
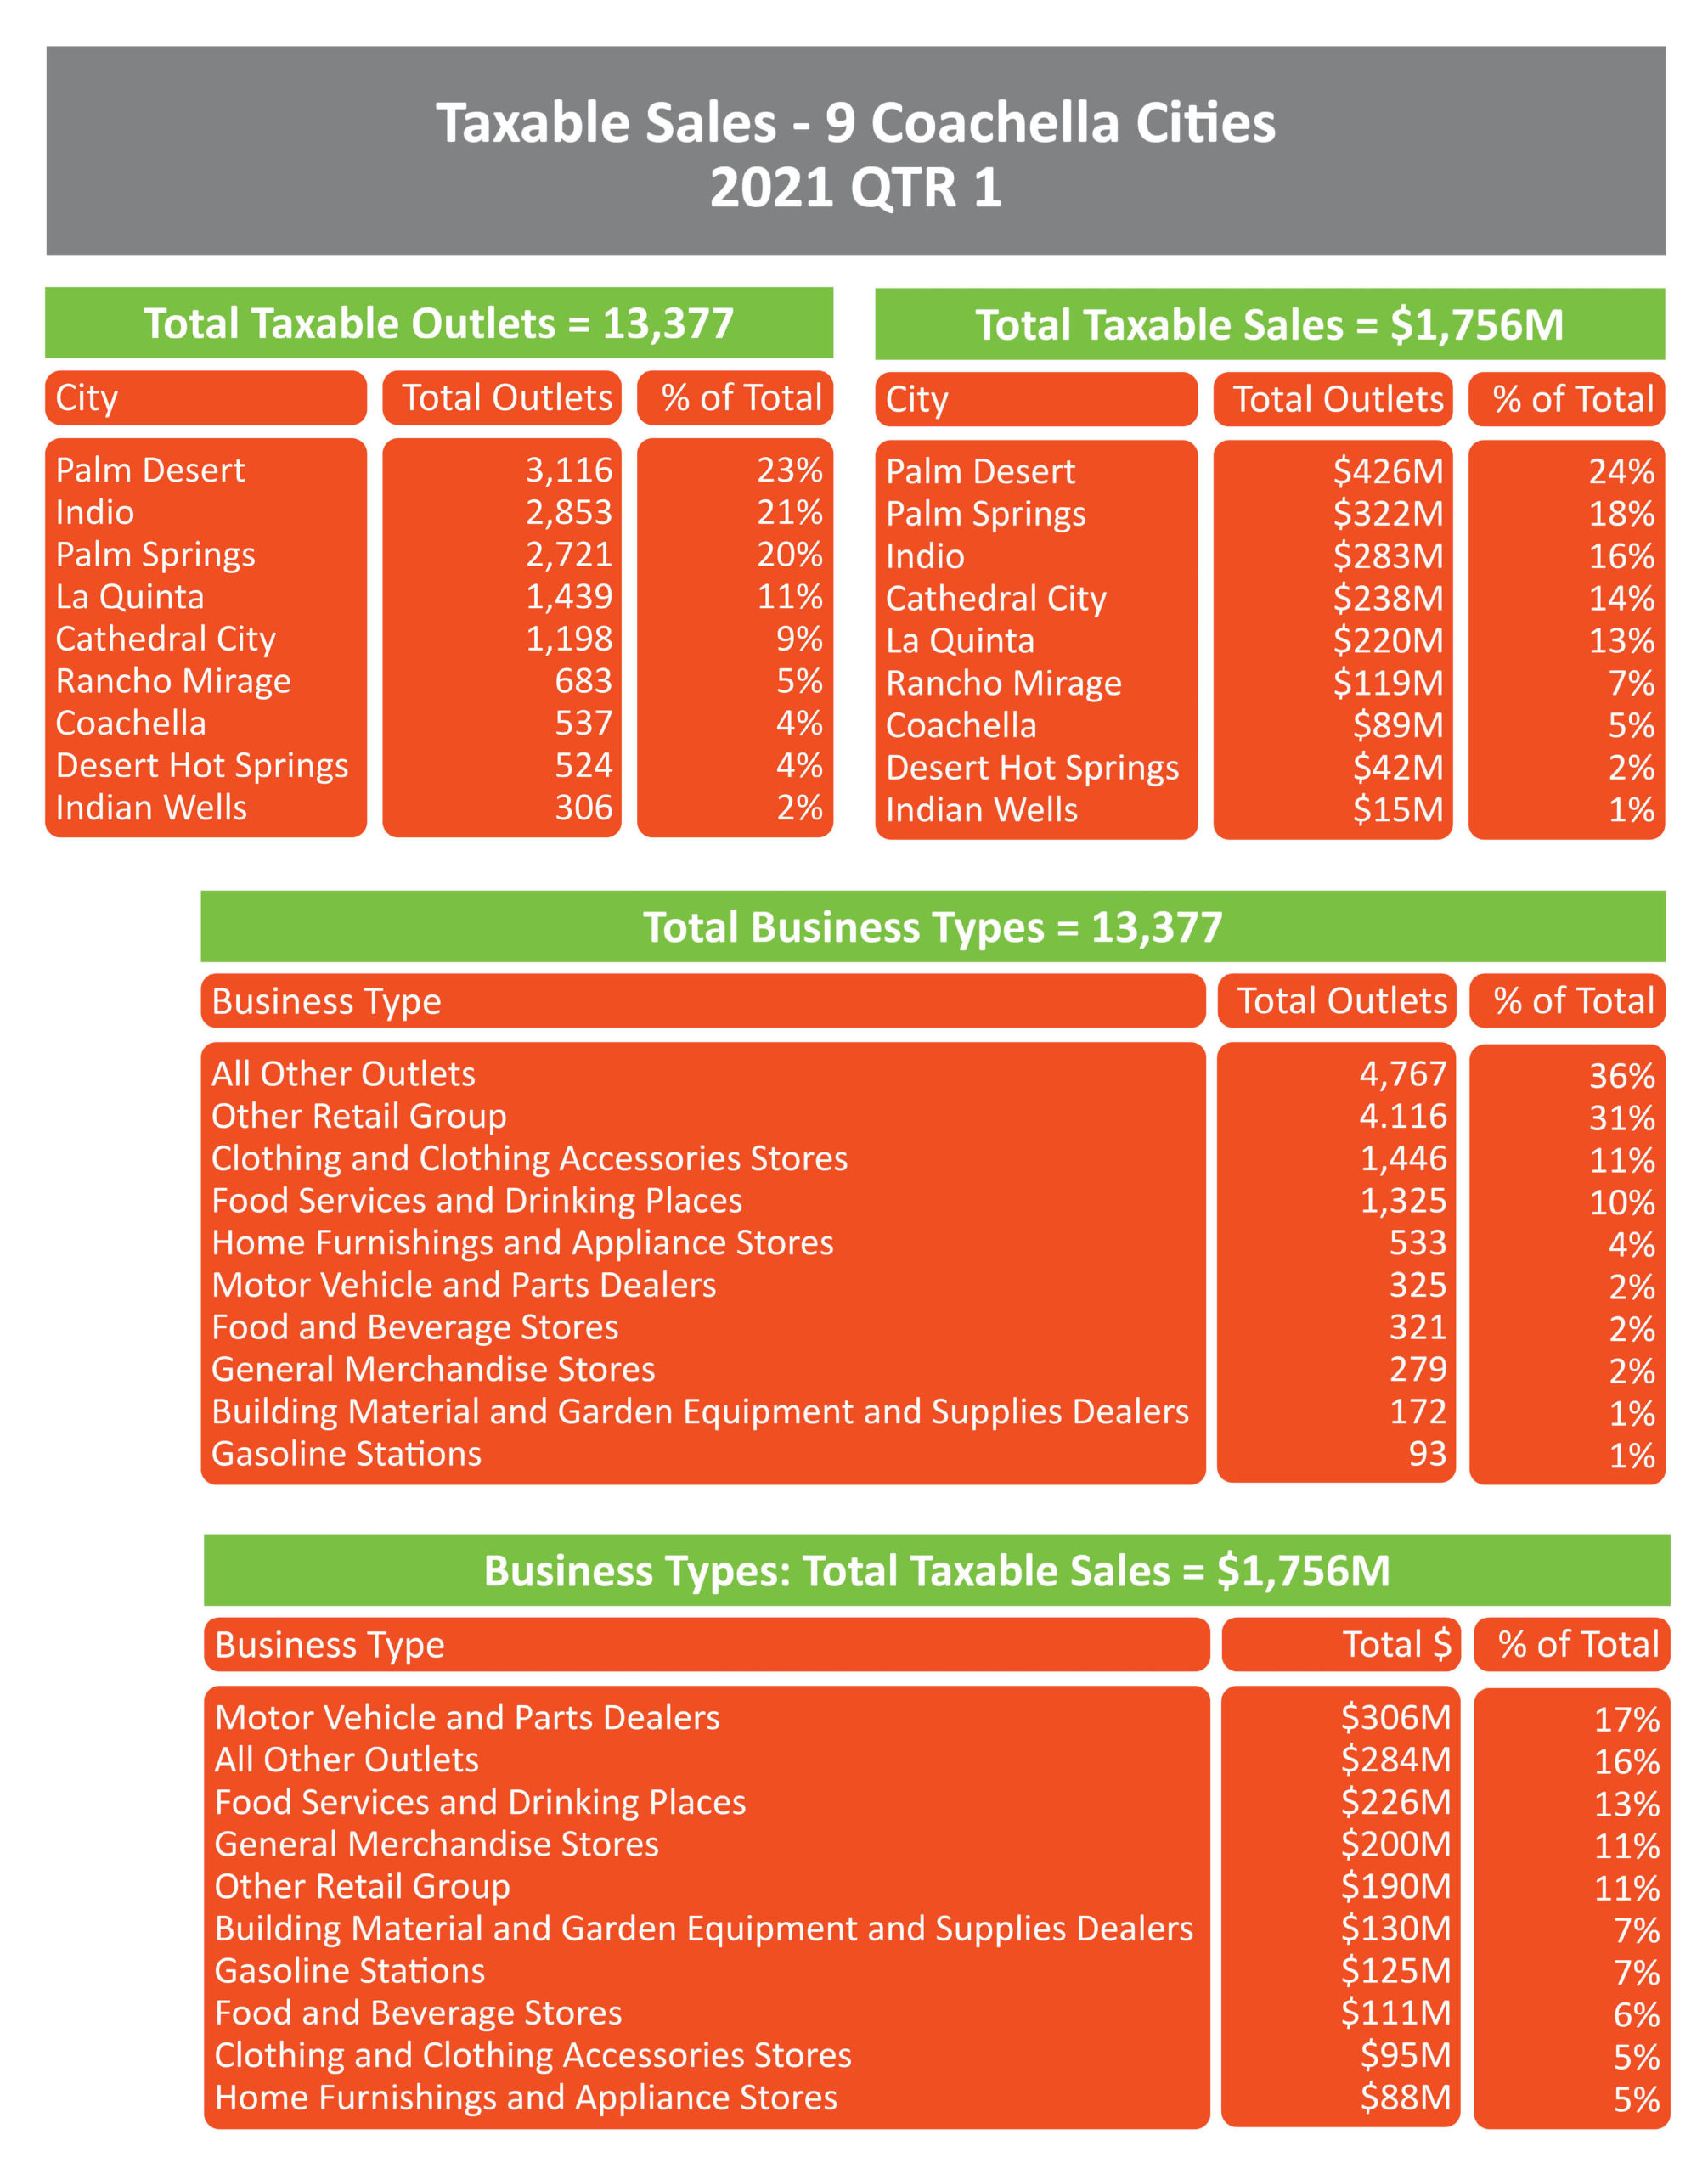
The following tables and graphs show the distribution of business outlets and total taxable sales for these 10 business sectors. These data are for the first quarter of 2021. The first tables show the proportion and rankings of total business outlets and total taxable sales for the 9 cities combined. The next graphs show similar proportions and rankings for each of the 9 cities.
Note a comparison of outlets vs. sales for the nine cities. Indio ranks 2nd for total outlets, but 3rd for total taxable sales. Cathedral City ranks 5th for outlets, but 4th for taxable sales. This is no doubt due to the prevalence of auto dealers located in Cathedral City and the relatively high tax revenue they produce. This is reinforced by comparing the rank of motor vehicle and parts dealers outlets – 6th, with its 1st rank in total taxable sales.
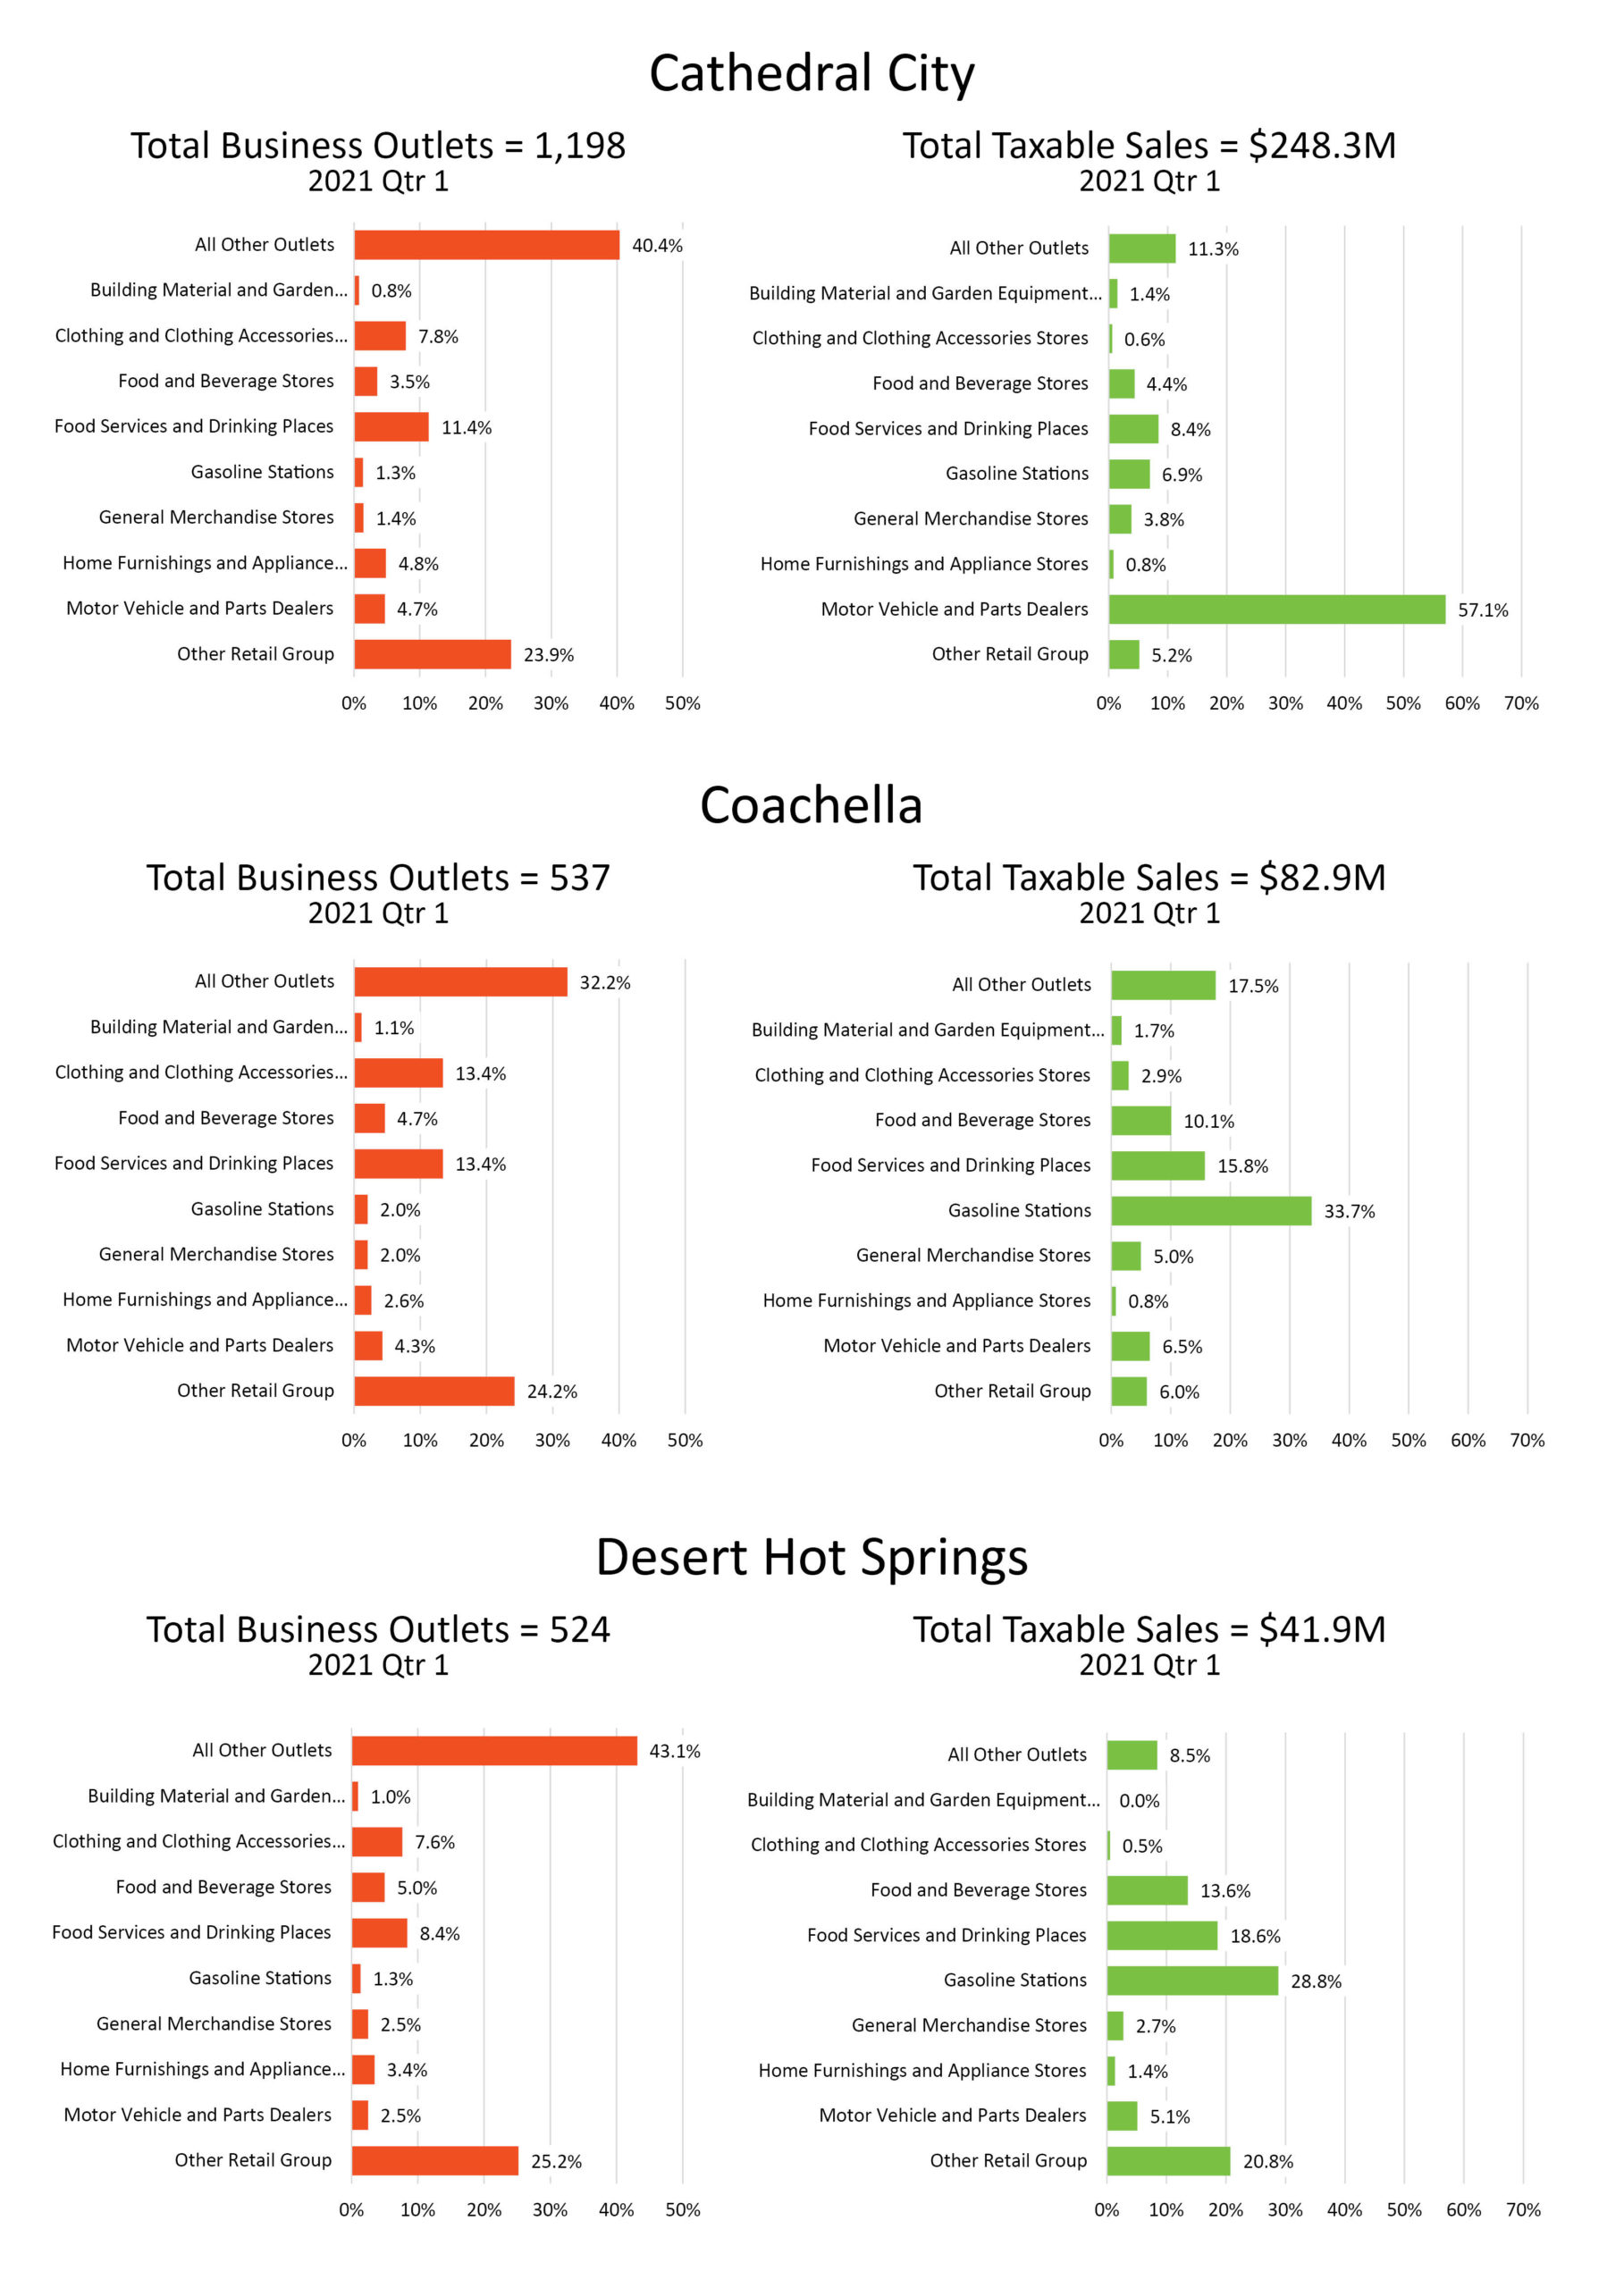
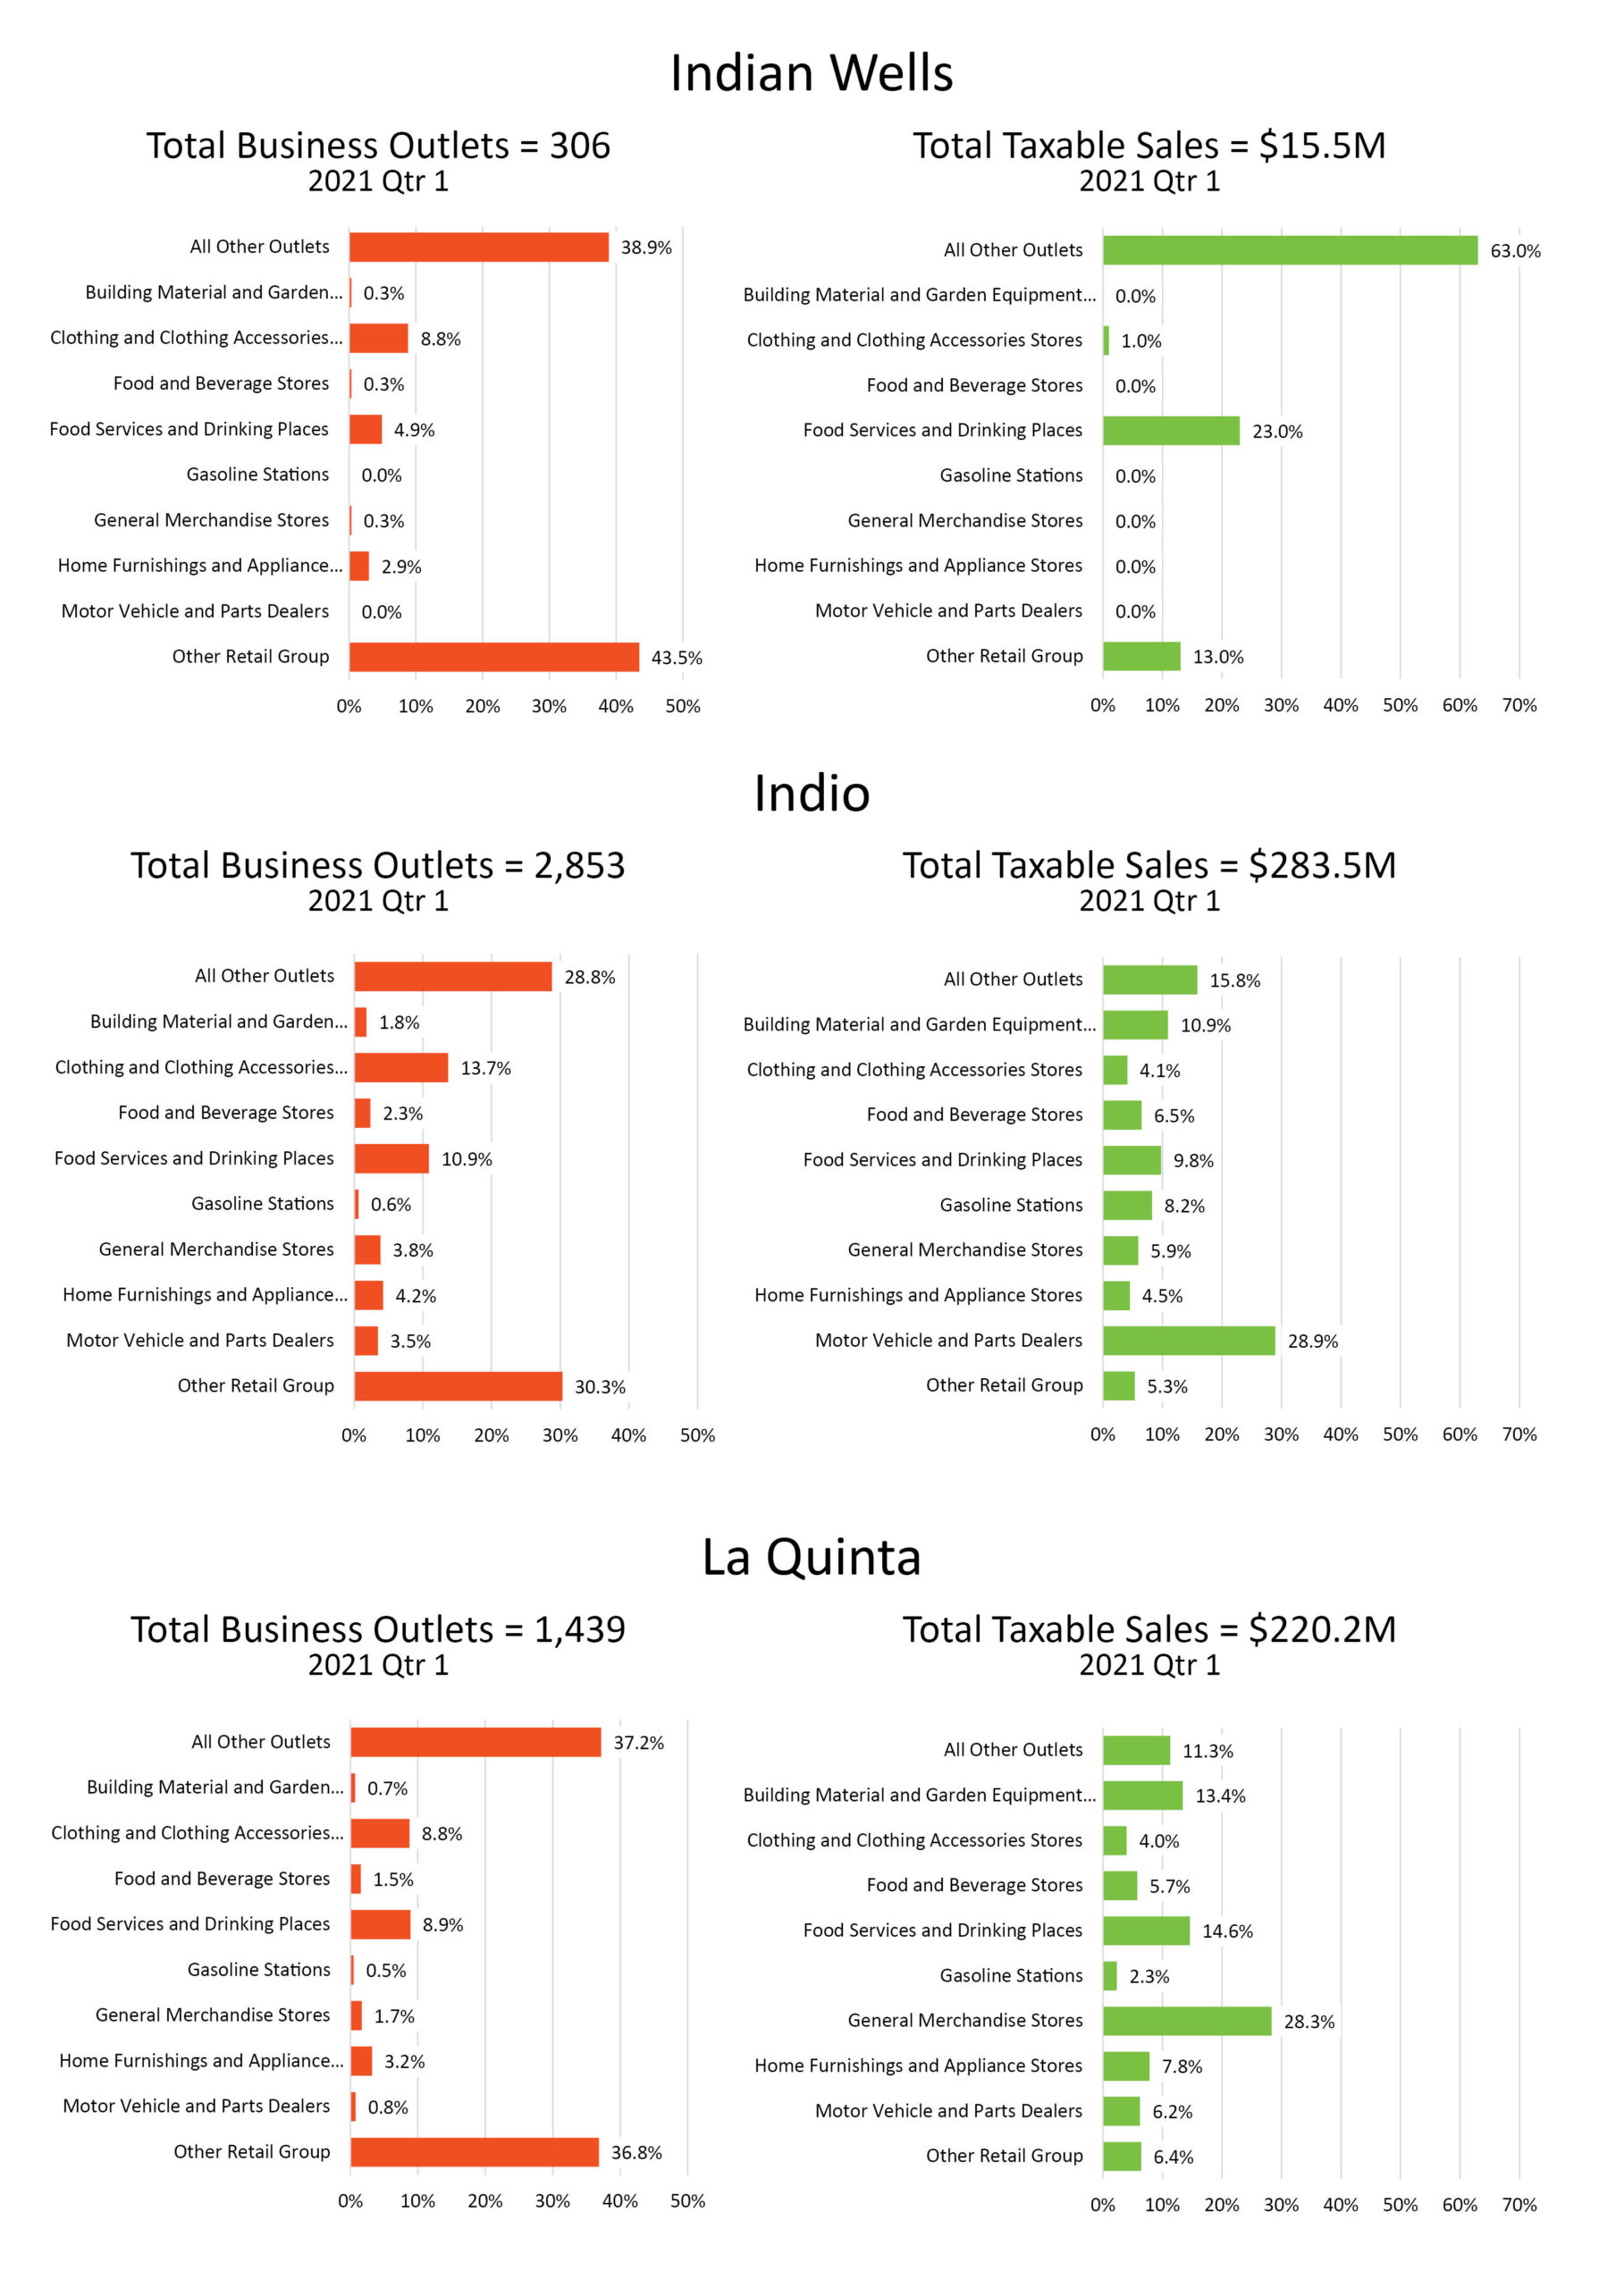
These graphs show the distribution of the 10 reported business types for each city for Quarter 1 of 2021. The business sectors are in ascending alphabetical order for easy comparison by city. The horizontal axis is the same for each respective graph to see the relative scale of business distribution throughout the valley cities. The highest concentration of business outlets is Other Retail Group in Indian Wells – 43.5% of all outlets in that city. Indian Wells also has the highest concentration for taxable sales – Other Retail Group at 63% of total taxable sales.


