
So much is happening now – a pandemic, inflation, major supreme court rulings. How you prioritize or interpret these major events may well depend on your generation. Perhaps you are a baby boomer, well into retirement with its associated concerns. Maybe you were born after 1999, a Gen Z, and have an entirely different perspective on the long life ahead of you. Today we will look at the distribution of the different generations in the Coachella Valley.
As a Geographic Information System (GIS) analyst, my primary data source is Esri’s Business Analyst Data. Esri, the leader in GIS technology, headquartered in nearby Redlands, is a highly respected source for up-to-date estimates of demographic and socioeconomic data. They recently released their new 2022 estimated data set based on the 2020 Census. Esri uses sophisticated geostatistics and modeling to create highly accurate and local estimates. Since the Coachella Valley is just a small part of a very large Riverside County, and a doubly large Riverside-San Bernardino-Ontario Metropolitan Statistical Areas (MSA), I rely on these estimates for accurate local data.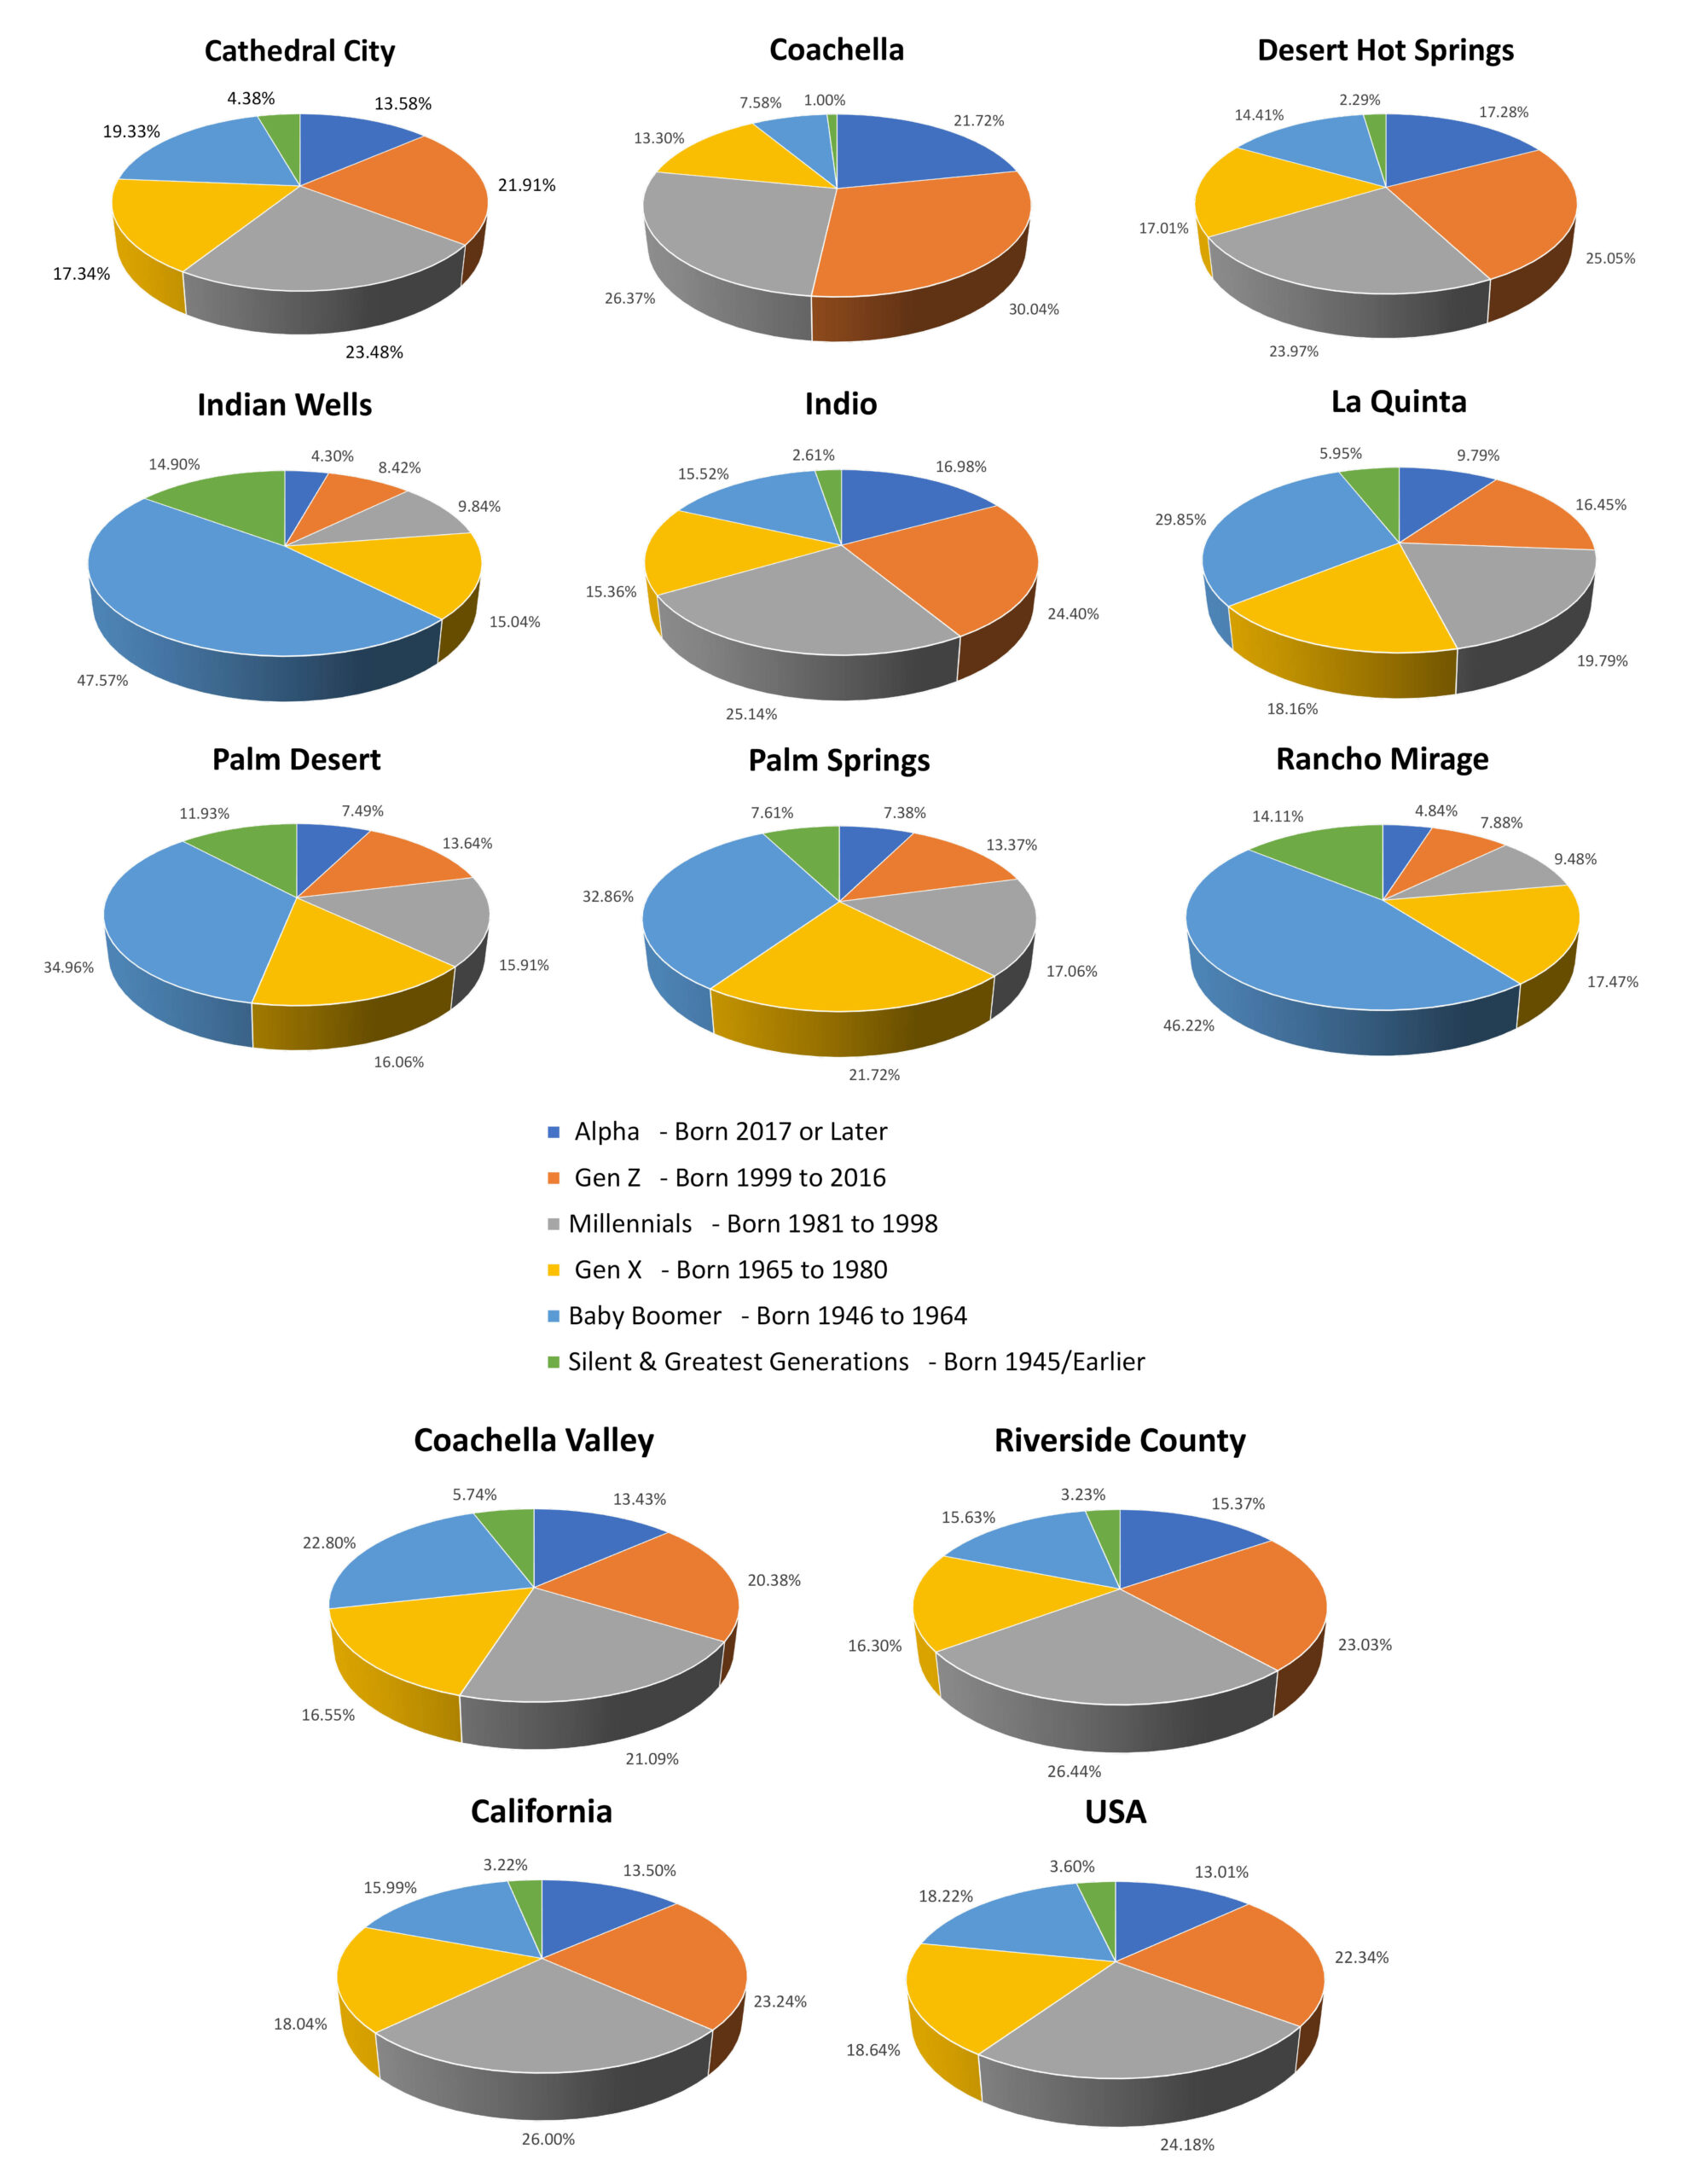
These pie charts are good examples of such local data. They show the 5-year estimate (2027) of the future generational distribution in our local cities and comparative geographies. Take a minute to look at the respective slices of the generations and how they compare to Riverside County, California, and the US. Cathedral City, Desert Hot Springs, and Indio most reflect the US distribution. By contrast, over half of the population of Indian Wells, Palm Desert, Palm Springs, and Rancho Mirage are either Baby Boomers or the Silent & Greatest Generation.
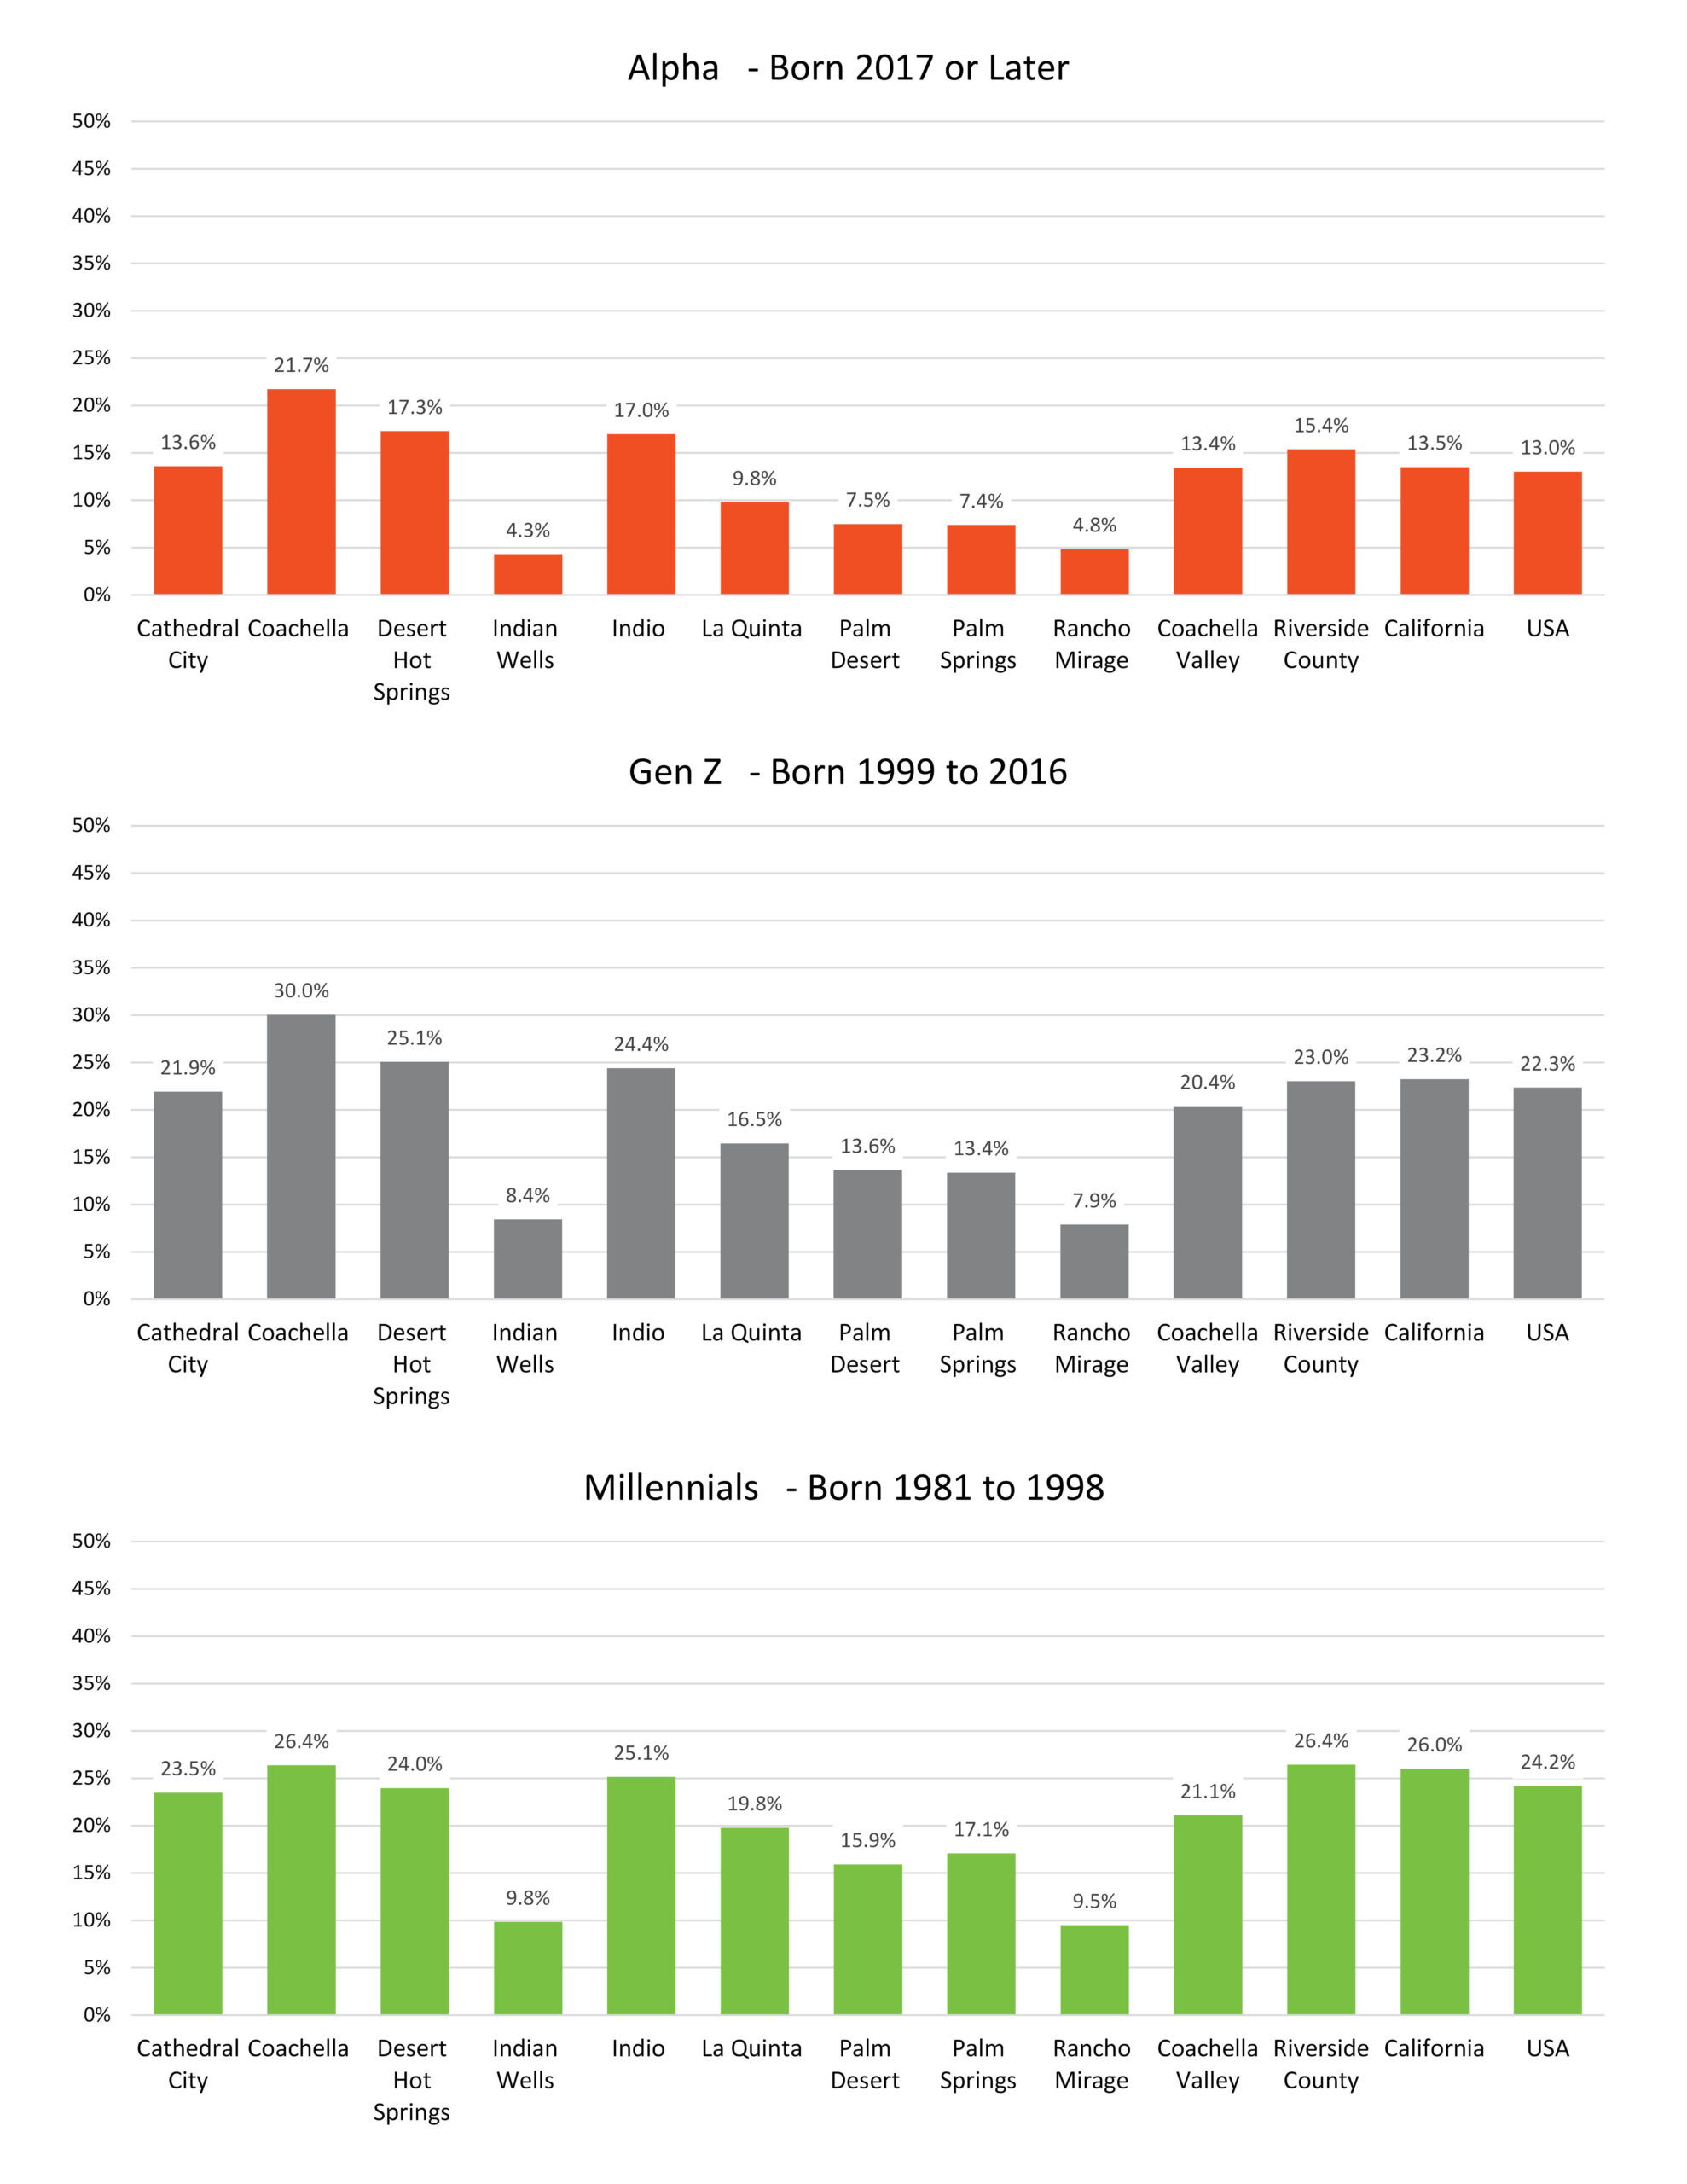
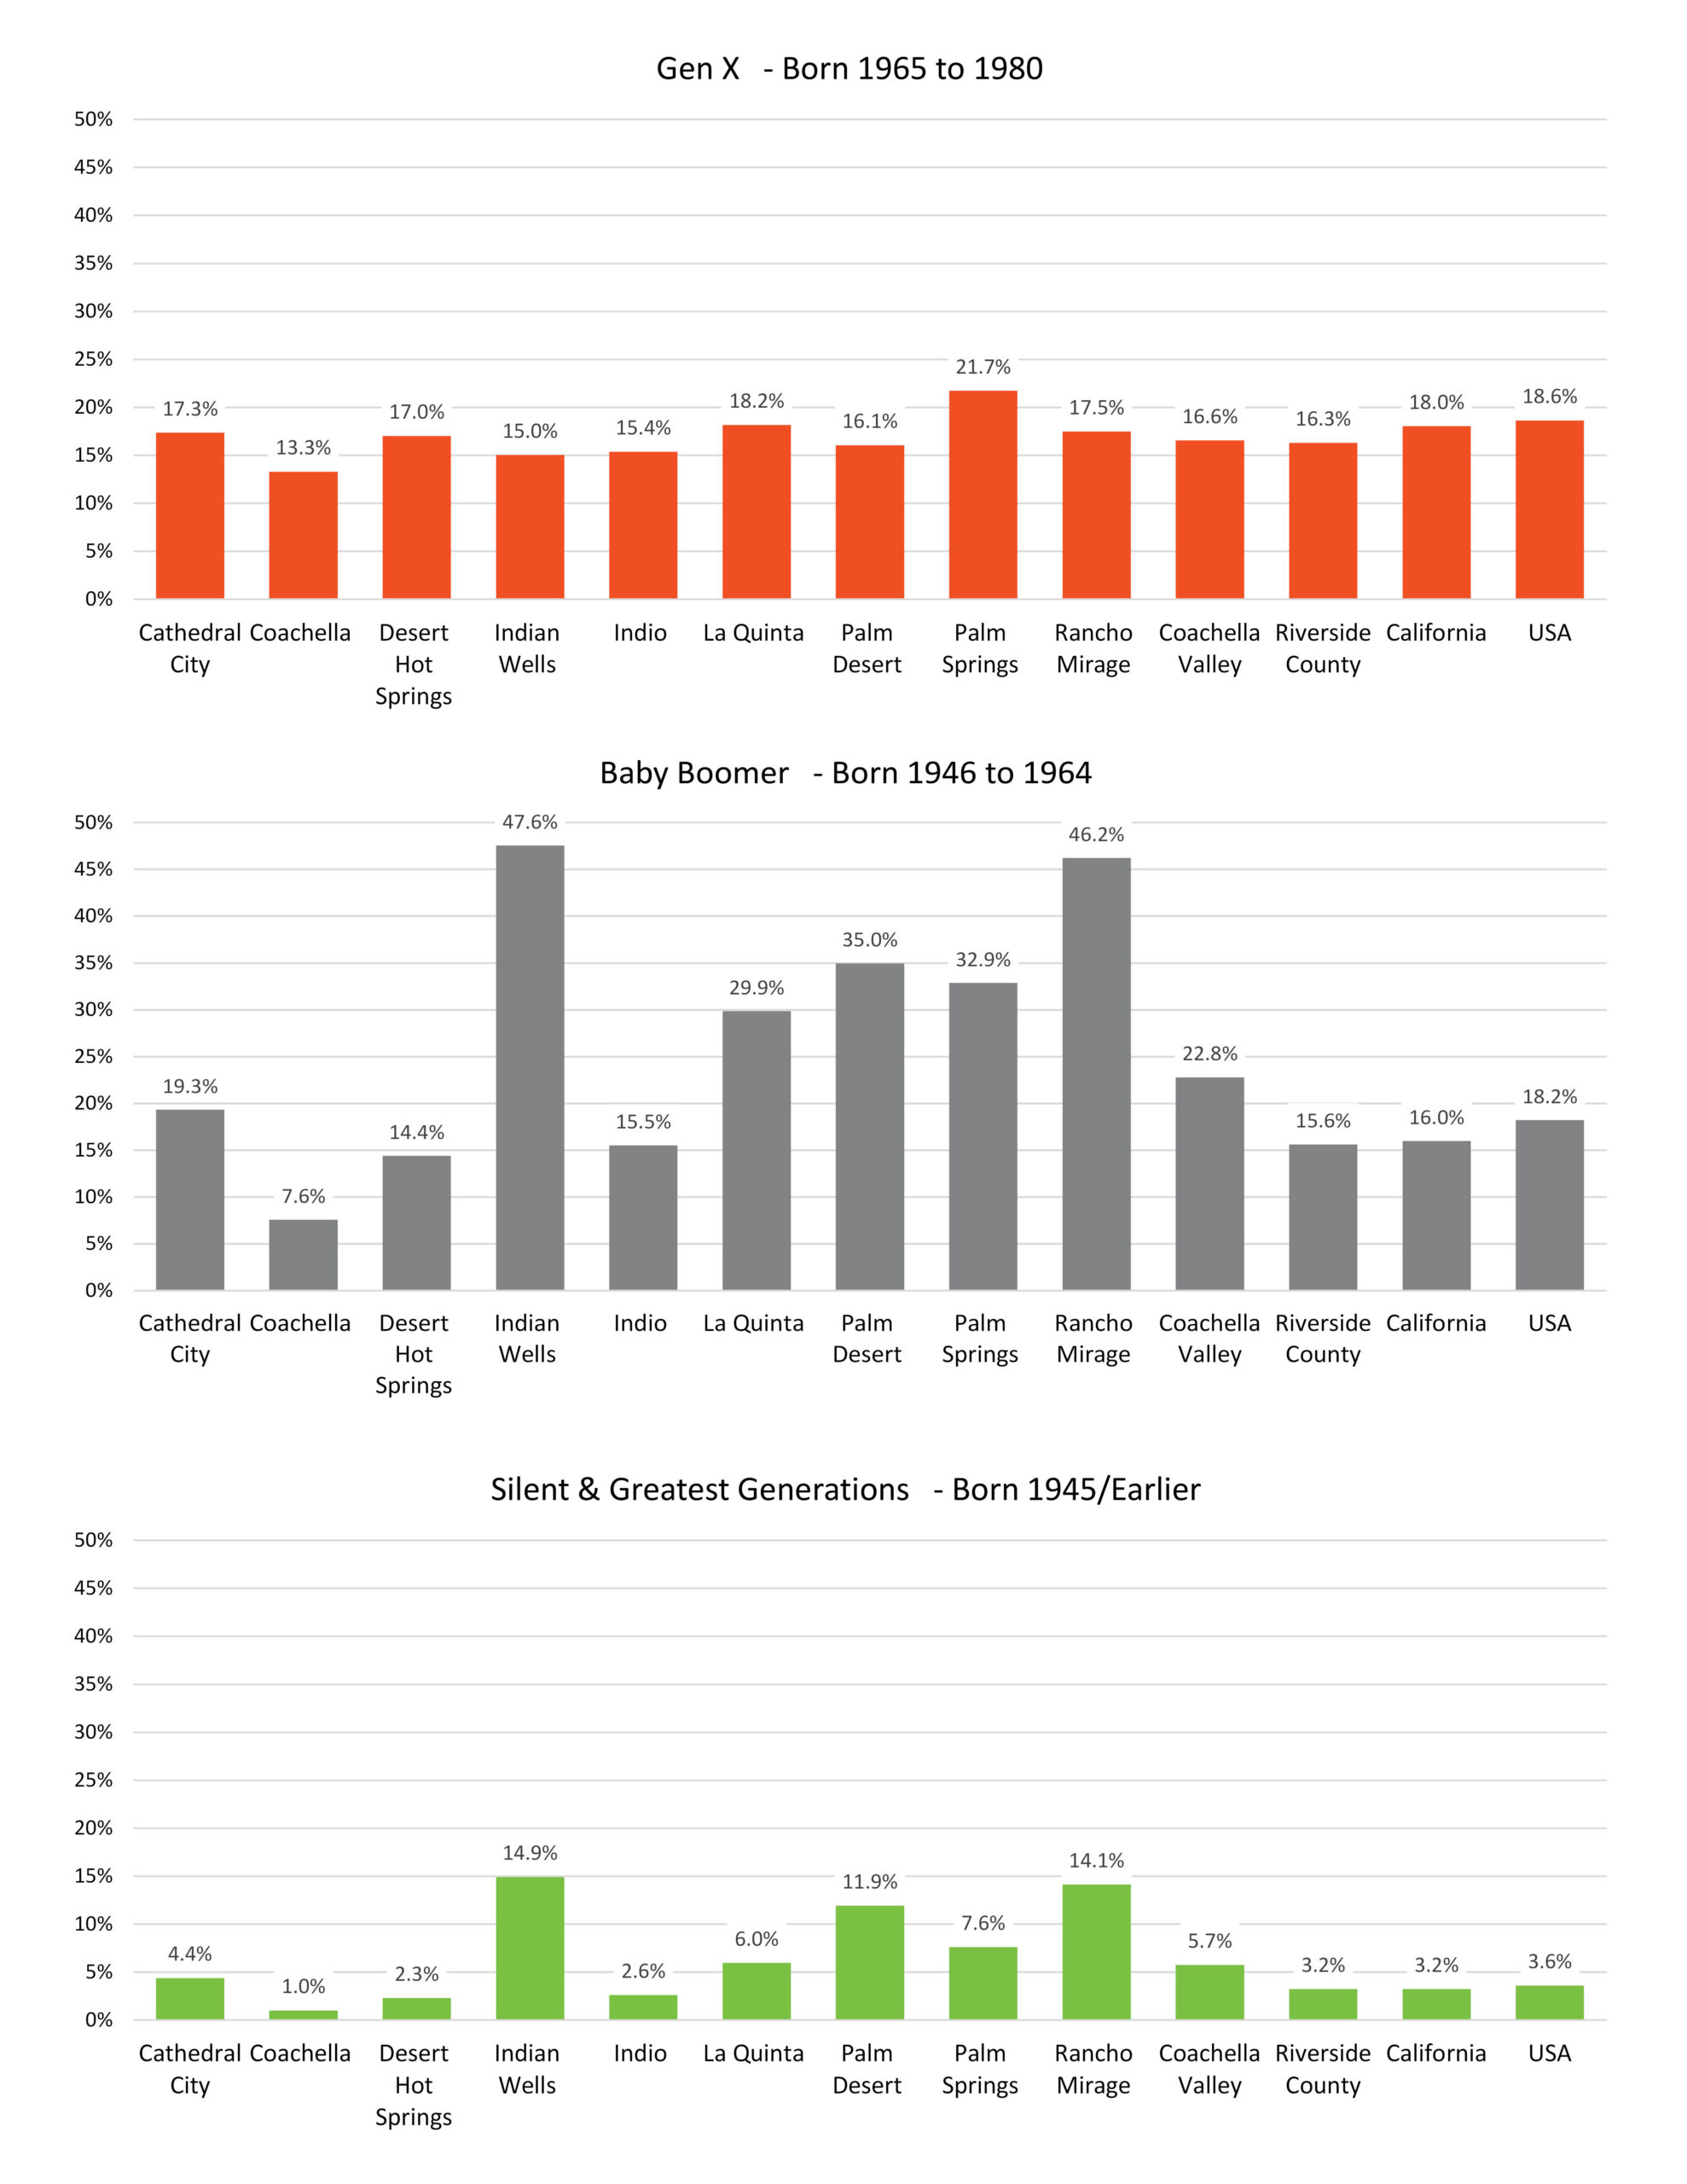
These tables show how each generation is distributed within the 9 Coachella Valley cities and the comparative geographies. Overall, our population of Millennials most closely mimics that of California and the nation. Not surprisingly, we have a much higher concentration of the oldest two generations.

