

I always find it fascinating to see how the Coachella Valley compares demographically with other geographic areas. Such comparisons give a fresh perspective on what is unique about our Valley. What are our particular strengths and weaknesses? Today we will compare the distribution of our workforce in terms of “class of worker.” The US Census surveys households throughout the years between the decennial census. This is called the American Community Survey. Class of workers is one of many subjects surveyed by the ACS. Class of workers categorizes workers based on the ownership type of the employing organization. We will take a look at the distribution of the class of workers in the Coachella Valley and how it compares with other geographies like the whole state of California.
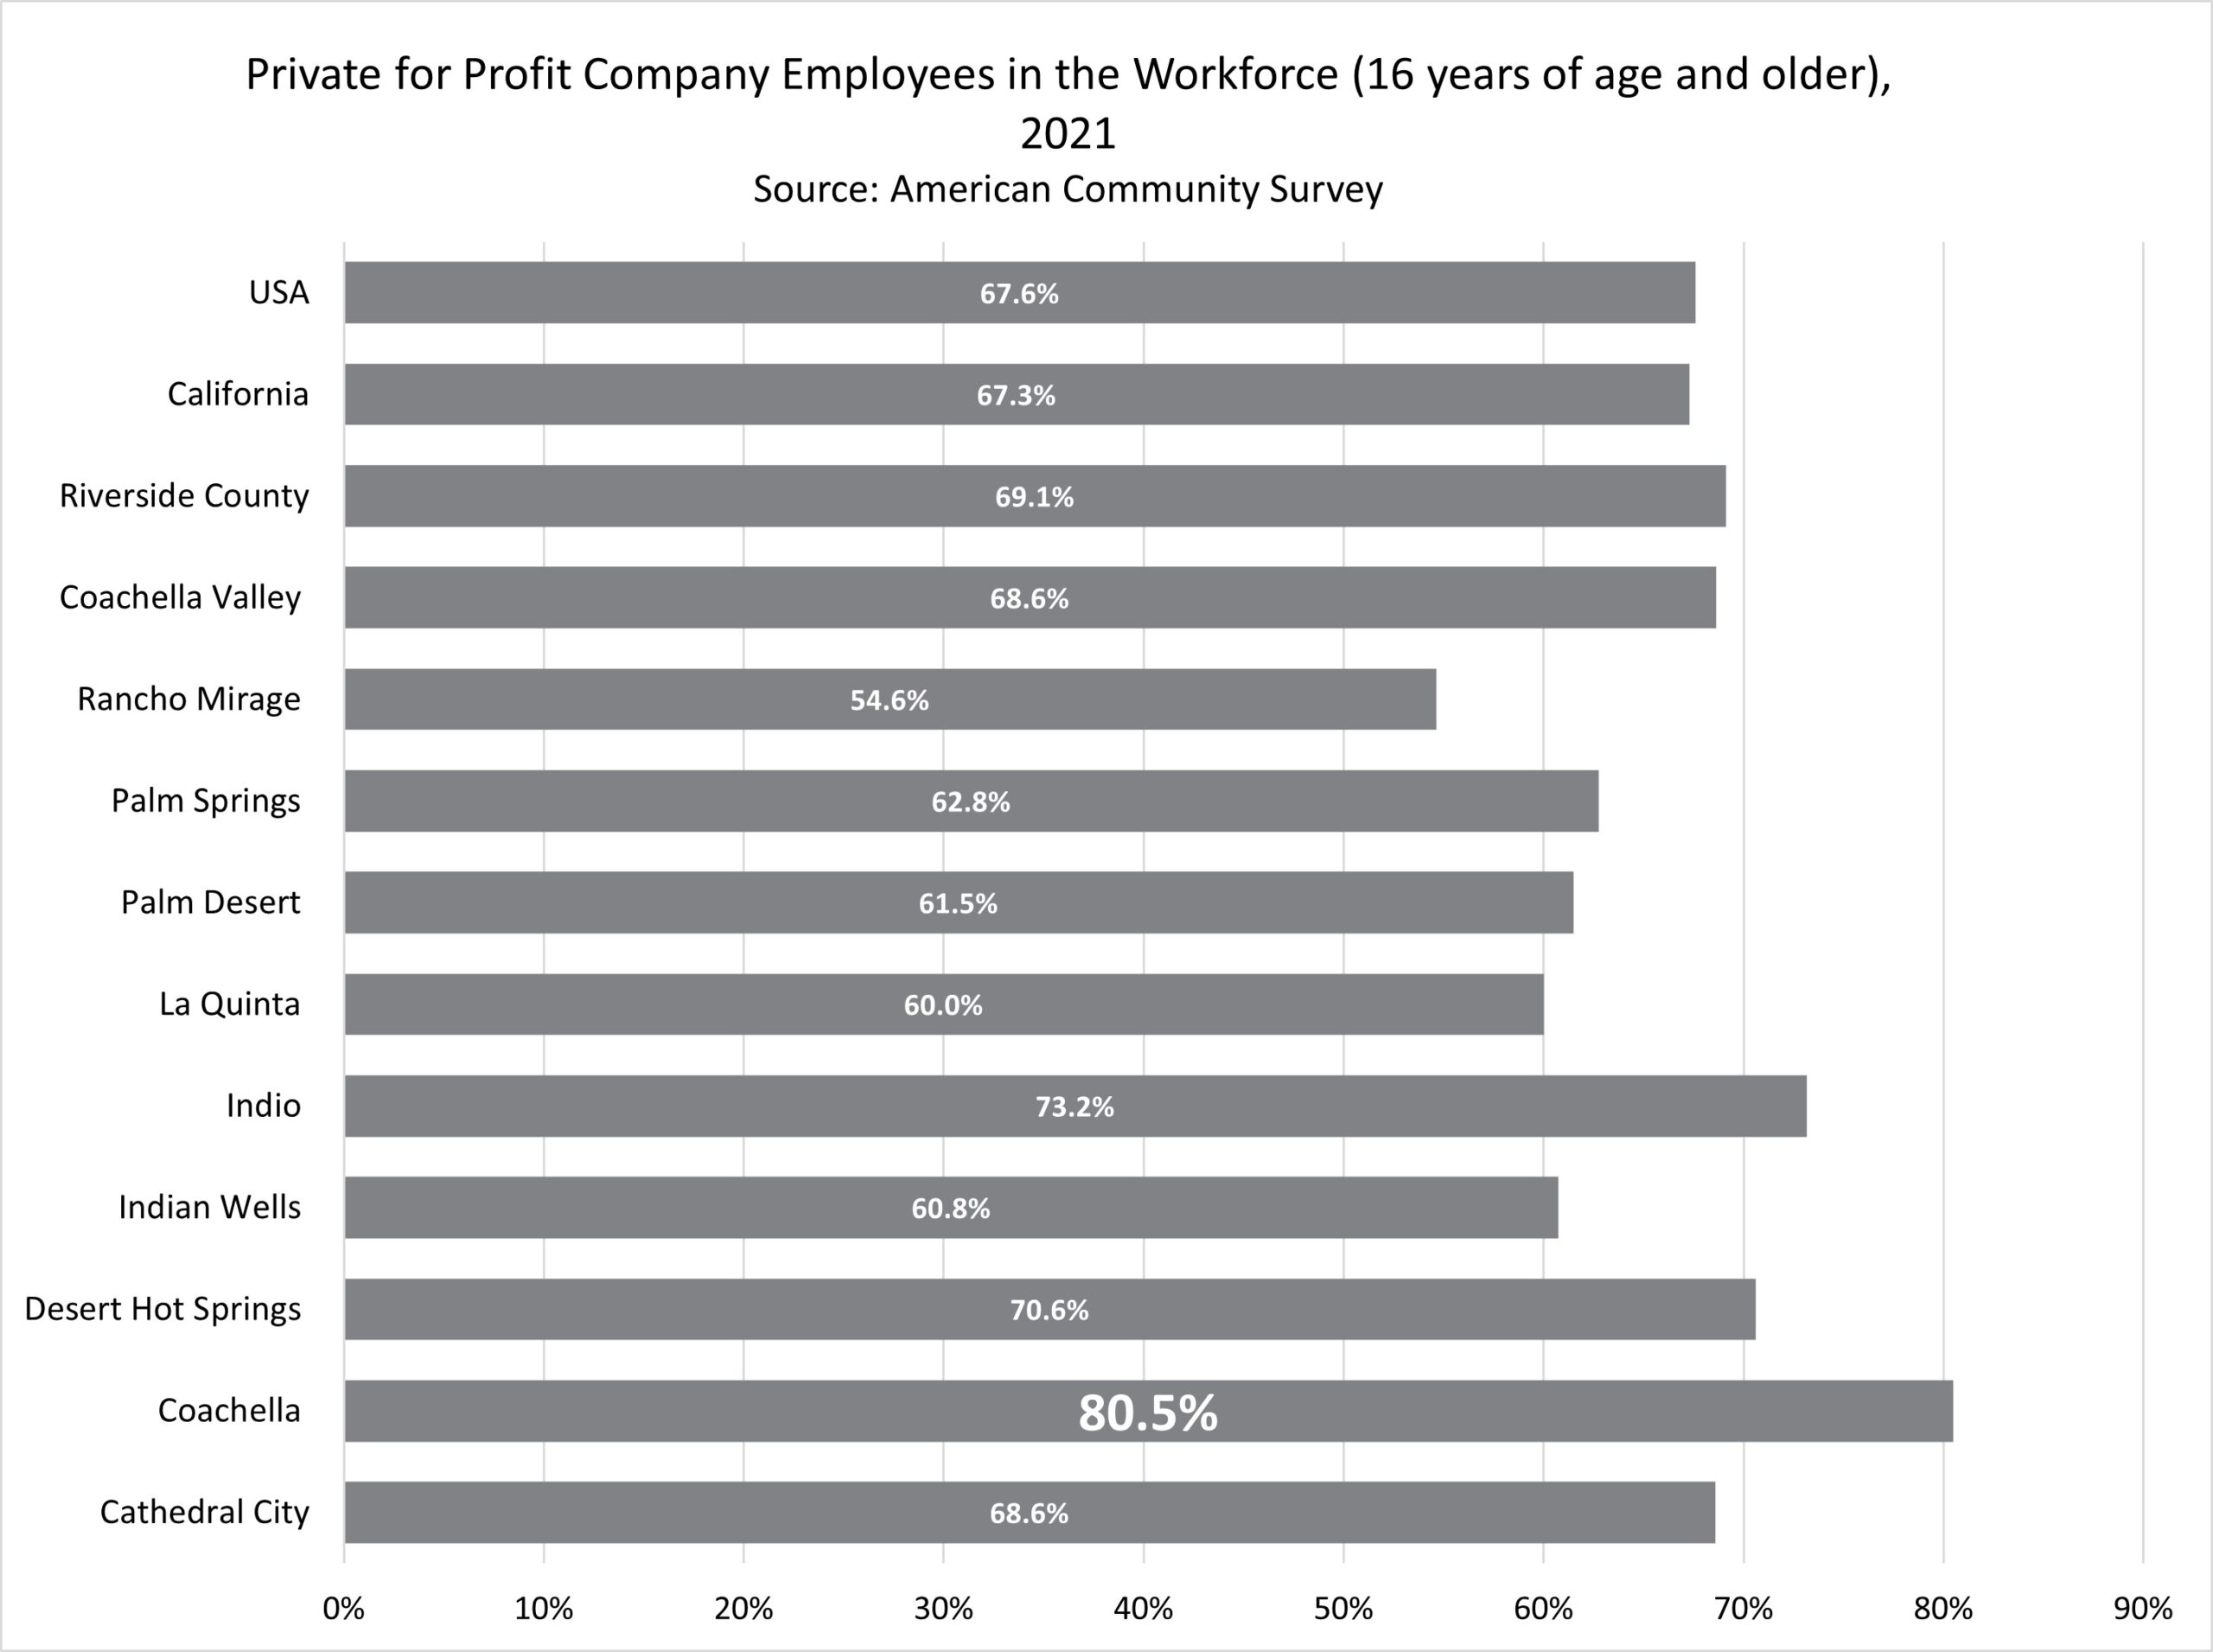
The primary class of workers in all geographies is employees who work for private sector, for-profit companies. This class in the Coachella Valley comprises 68.6% of all workers, slightly above the US average of a little more than two-thirds of employment. But for Coachella Valley cities, there is a 25-point range between the lowest concentration (Rancho Mirage – 54.6%) and the highest (Coachella 80.5%).
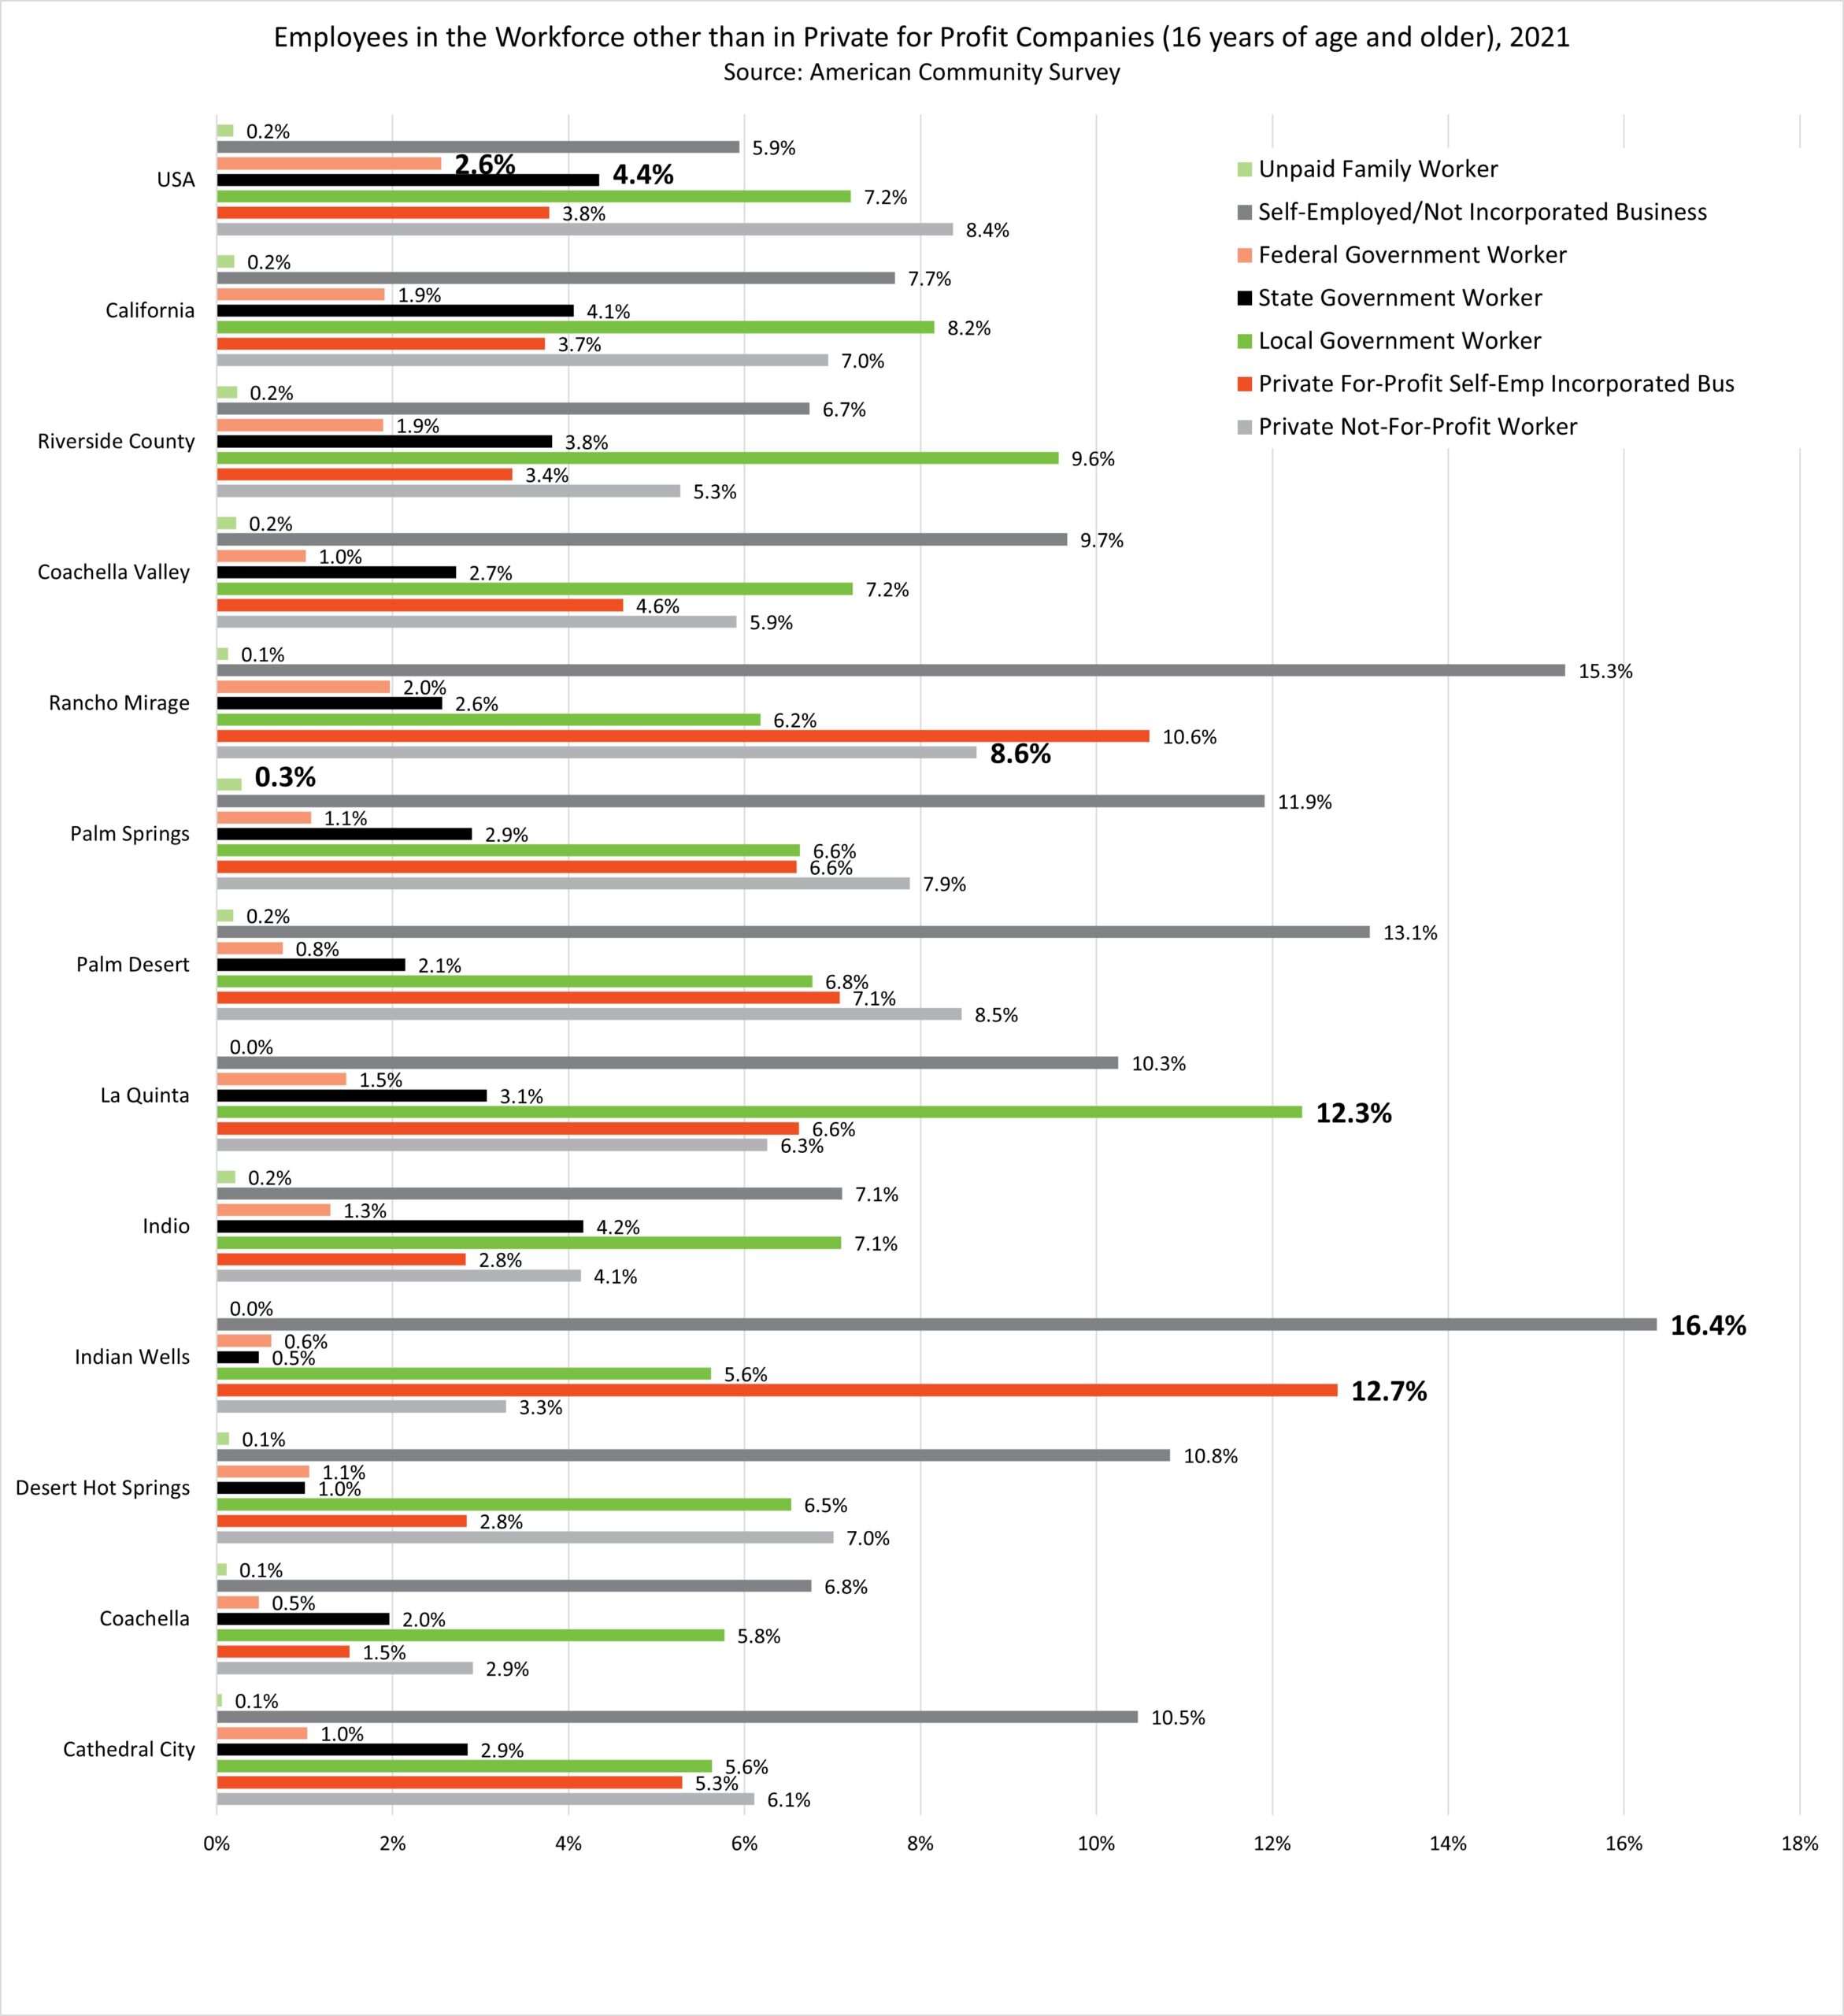
Besides the predominant for-profit work sector, there are seven additional categories of class of worker delineated by the ACS.
- Unpaid family workers – people who work without pay in a business or on a farm operated by a relative
- Self-employed in own not incorporated businesses – people who work for profit or fees in their own unincorporated business, profession, or trade, or who operated a farm
- Federal, State, and Local government workers
- Private for-profit self-employed incorporated businesses
- Private not-for-profit workers
Within these categories, there exists a substantial range of distribution. The self-employed/not incorporated business worker is the largest category in the Coachella Valley (9.7%), significantly higher than the national average of 5.9%. Rancho Mirage and Indian Wells are outliers here at 15.3% and 16.4% respectively.
The next largest category in the Coachella Valley is local government employment, right on par with the US average of 7.2% of the workforce. La Quinta wins in this category with 12.3% of its workforce working in local government.
The Valley has fewer private not-for-profit workers (5.9%) than the US average (8.4%). It has more private for-profit, incorporated self-owned business workers (4.6%) than the US average (3.8%), with Indian Wells leading the way at 12.7% of its workforce. The Valley has far fewer state government workers (2.7%) than overall in the US (4.4%), and over half of the US average of federal government workers, 1% vs. 2.6%.


