

We’re back to another interactive map for today’s Data Digest. Like the previous Household Income Comparisons map, this map allows you to explore 5 different map layers. These layers follow a theme of average household and family size in the valley and housing affordability for the typical family.
Several of the map layers are symbolized with a cartographic technique called dichromatic scales. Such symbology sets a “center” value for the numerical scale. Values above the center are symbolized by one hue and those below by another, with the darkest saturations the farthest away from the center. In these layers, I have used the national average to represent the center to easily distinguish areas above or below the national average. For example, the average family size in the US is 3.13. For that layer, 3.13 represents the center value.
CLICK HERE TO EXPLORE THE WEB MAP
The Web Map will prompt you to Sign in. You can select cancel unless you have an Esri ArcGIS Online Account which will give you access to copy this map and work with the layers.
The web map has 5 layers to explore. Each layer is symbolized by Census Block Group.
- Total Households
- Average Household Size
- 2.51 is the national average household size. Green block groups are, on average, below the national average and brown block groups are above this average.
- The average for all of the Coachella Valley is 2.60
- Riverside County = 3.12
- California = 2.85
- Average Family Size
- 3.13 is the national average family size. Yellow block groups are, on average, below the national average and blue block groups are above this average.
- The average for all of the Coachella Valley is 3.25
- Riverside County = 3.60
- California = 3.42
- Housing Affordability Index – Measures whether a typical household has enough income to qualify for a mortgage on an average-priced home in the area. A base of 100 represents median income that is sufficient to qualify for such a loan. Values above 100 indicate increasing affordability. Values below 100 indicate less affordability and insufficient income. Please note that these data are estimates for 2023. Household income and home prices have shown a lot of volatility in the last few years.
- 101.10 is the national average index. Red block groups are, on average, below the national average and grey block groups are above this average.
- The average for all of the Coachella Valley is 46
- Riverside County = 63
- California = 53
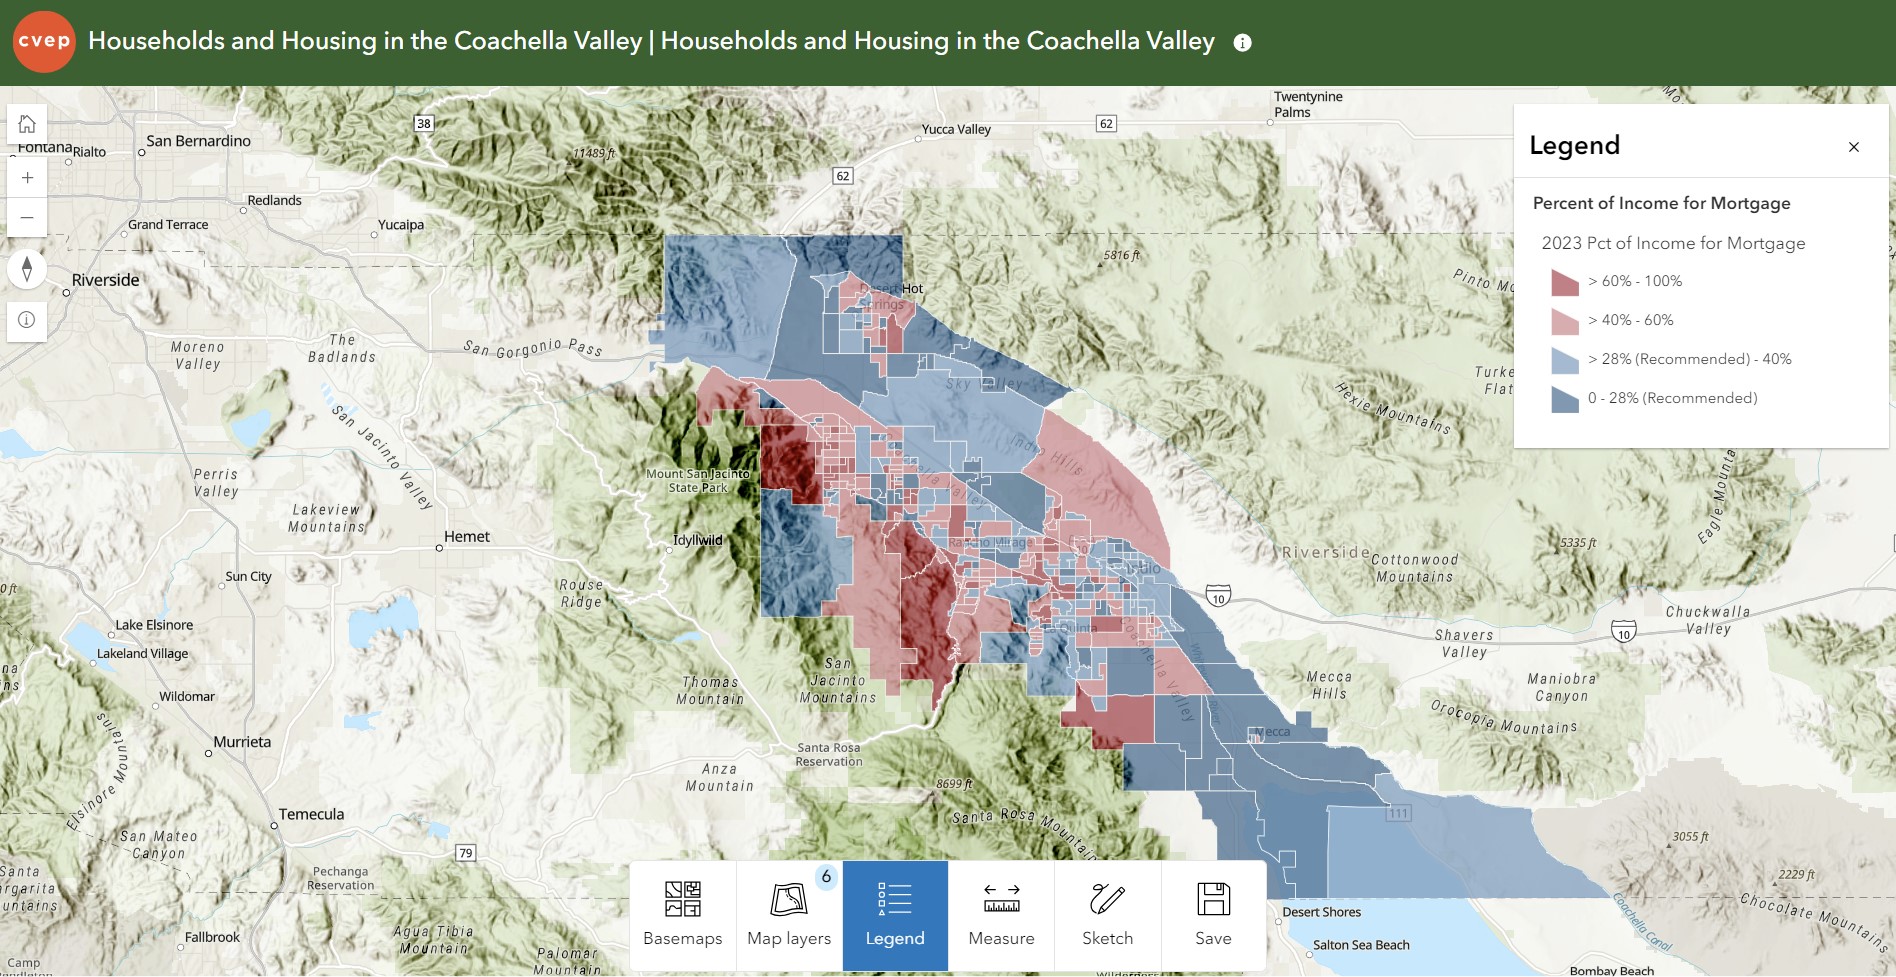
- Percent of Income for a Mortgage – The common rule of thumb is that your mortgage payment should be no more than 28% of your gross monthly income, including principal, interest, taxes, and insurance. This is meant to balance the possibility of buying a home while having enough money to cover other household expenses.
- 28% is the traditional rule of thumb. Blue block groups are, on average, below 28%, and rose block groups are above 28%.
- The average for all of the Coachella Valley is 51.4%
- Riverside County = 38.6%
- California = 47.3%
- US = 25.6%
All data are based on the 2020 Census and updated statistically by Esri Business Analyst for 2023
Those of you exploring the last 2 layers from the above list might be asking yourself why there are Census block groups that are wealthy but have low affordability indices and have a high percent of income going to mortgages. This is most likely because household income measured by the census is adjusted gross income and does not include retirement or investment income. So many of these areas with wealthy residents and high home prices do not account for other forms of wealth or net wealth.


