

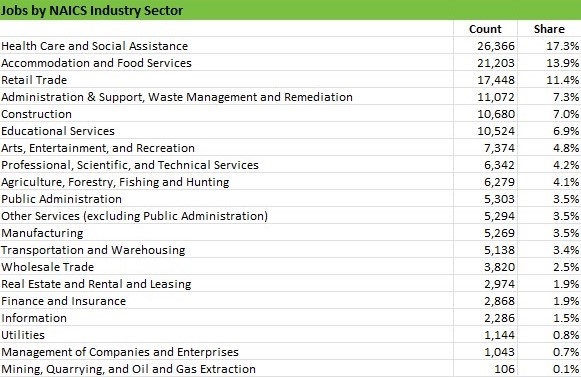
I don’t know about you, but I’m not much of a resolutions person. Instead, I see the new year as a time to reflect and recharge. In that spirit, as I usually do each New Year, we will look at some fundamental economic and socioeconomic data about the valley over the next few weeks. We will reflect. And today’s reflection concerns the general profile of our working population in the Coachella Valley. We will look at the distribution of the age of workers, their earnings, in what industry sectors they are employed, their respective race and ethnicity, and educational attainment.
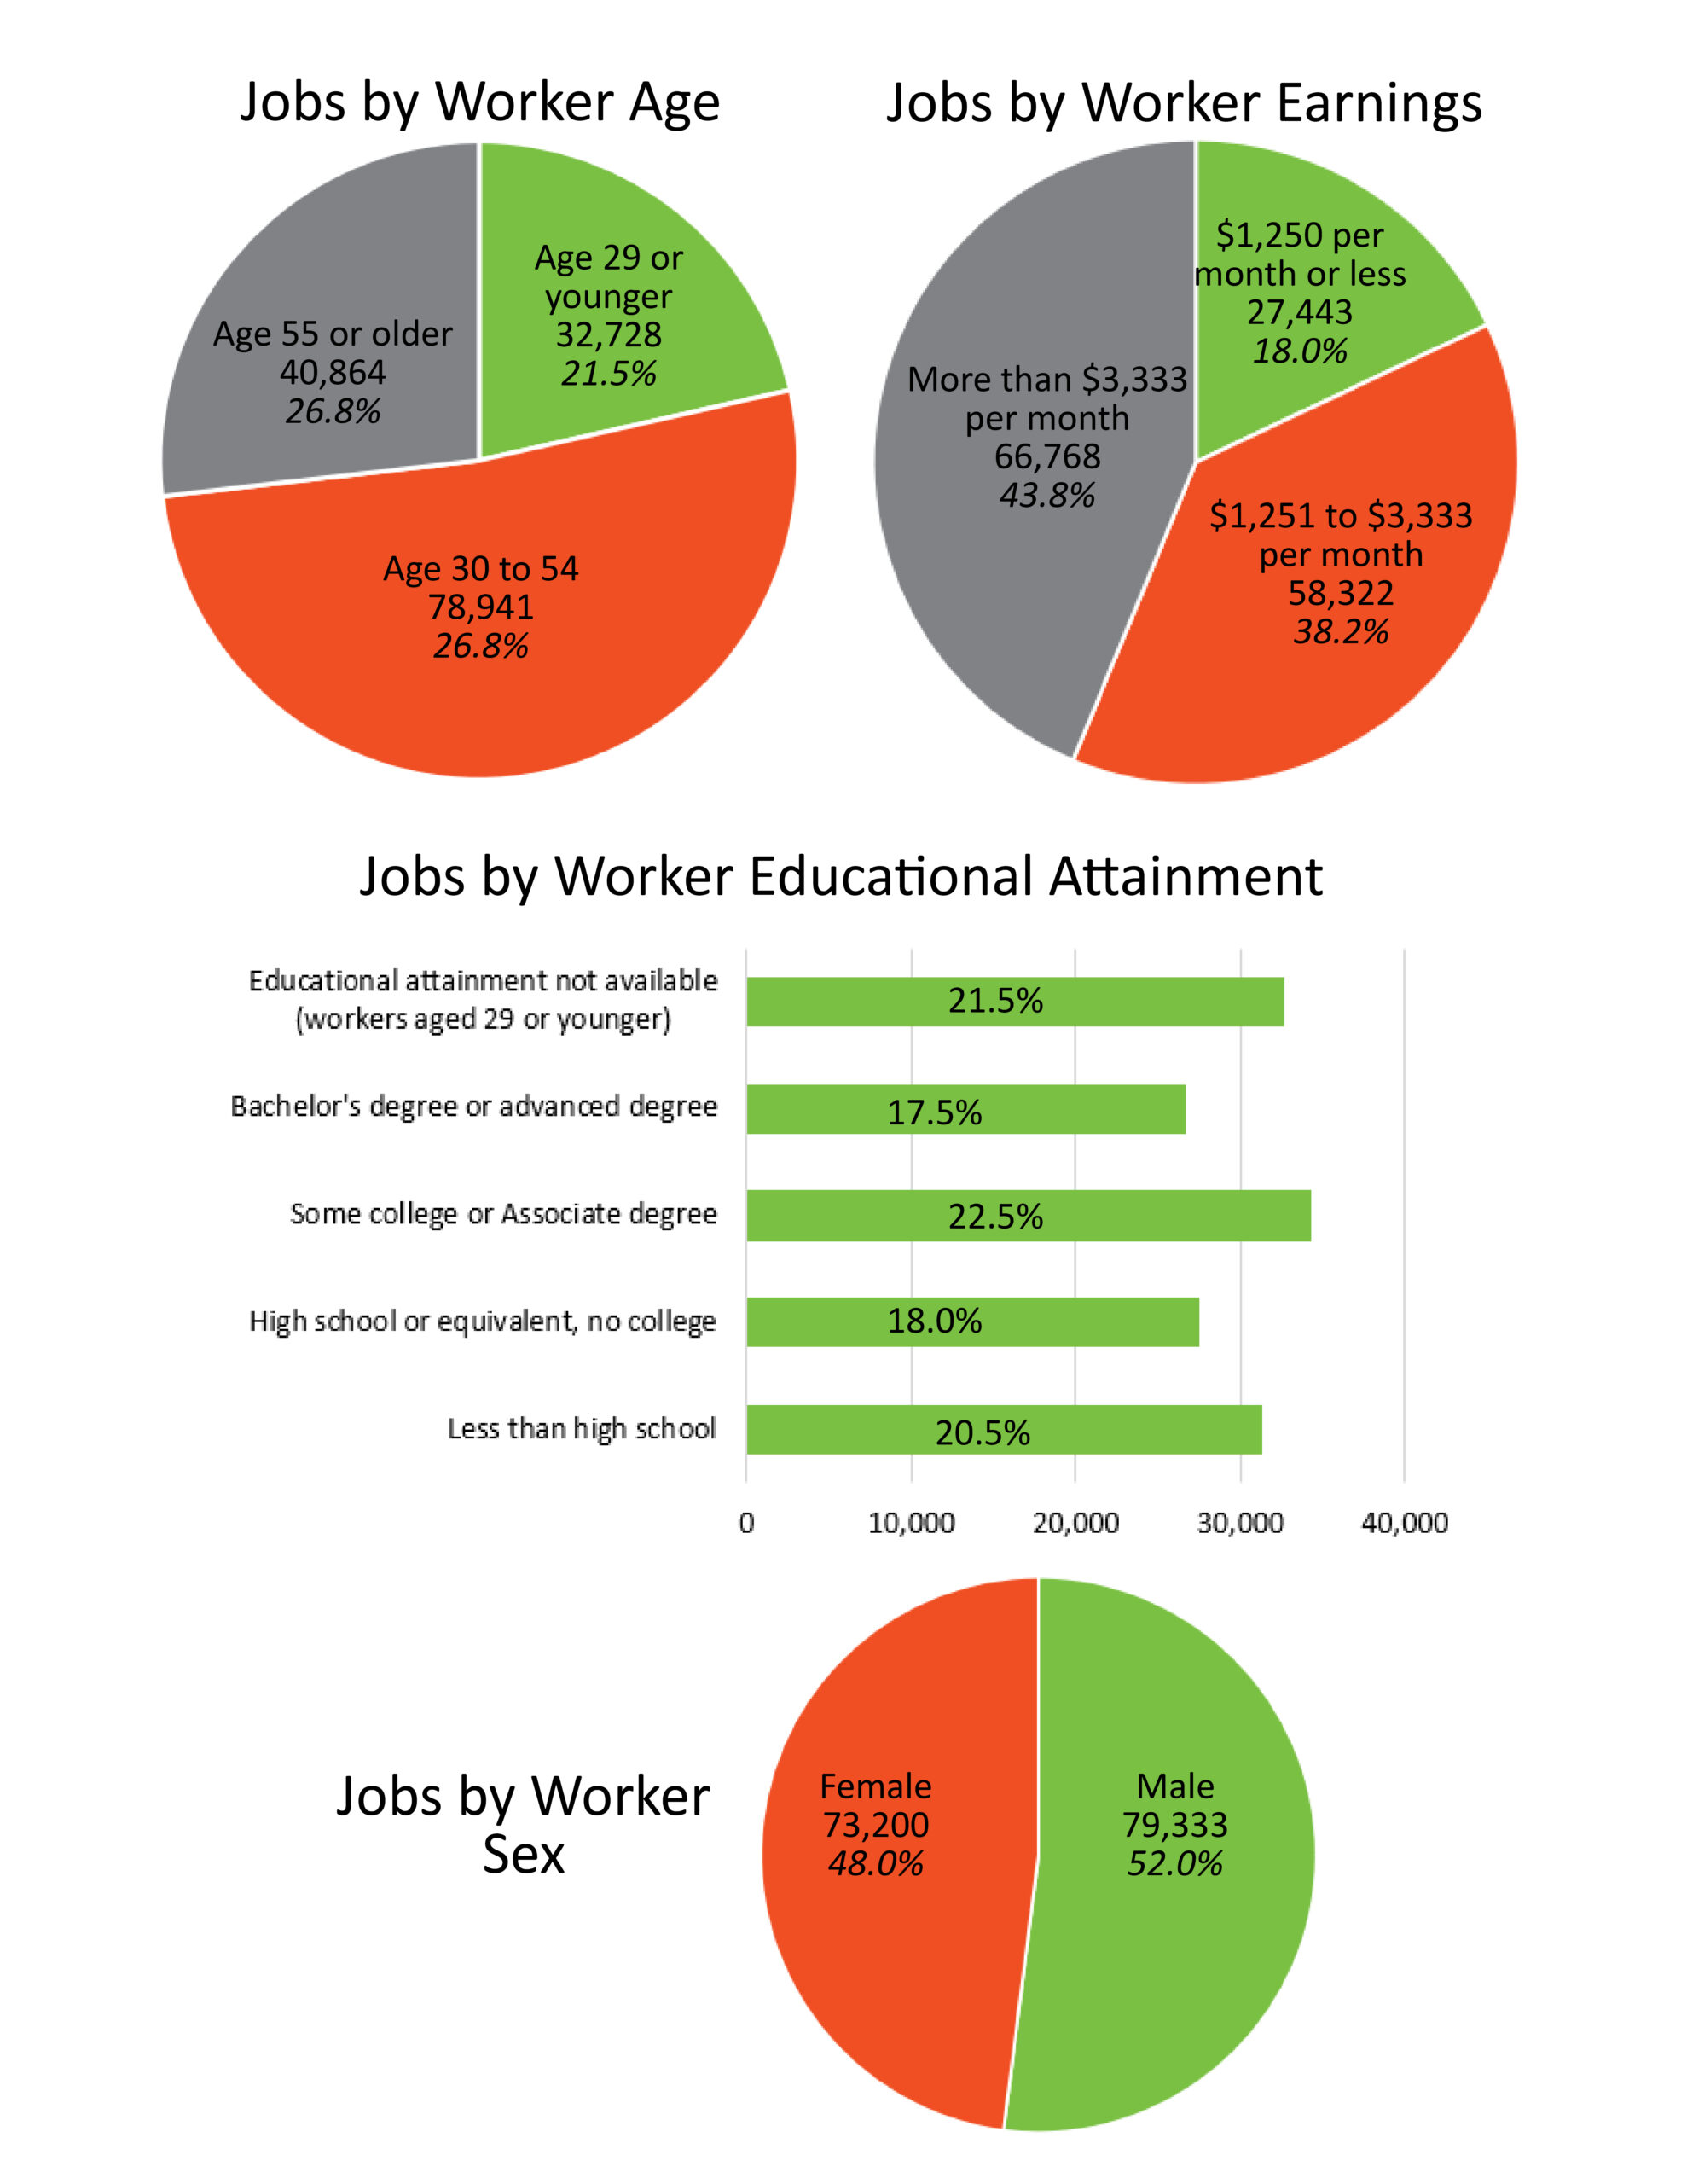
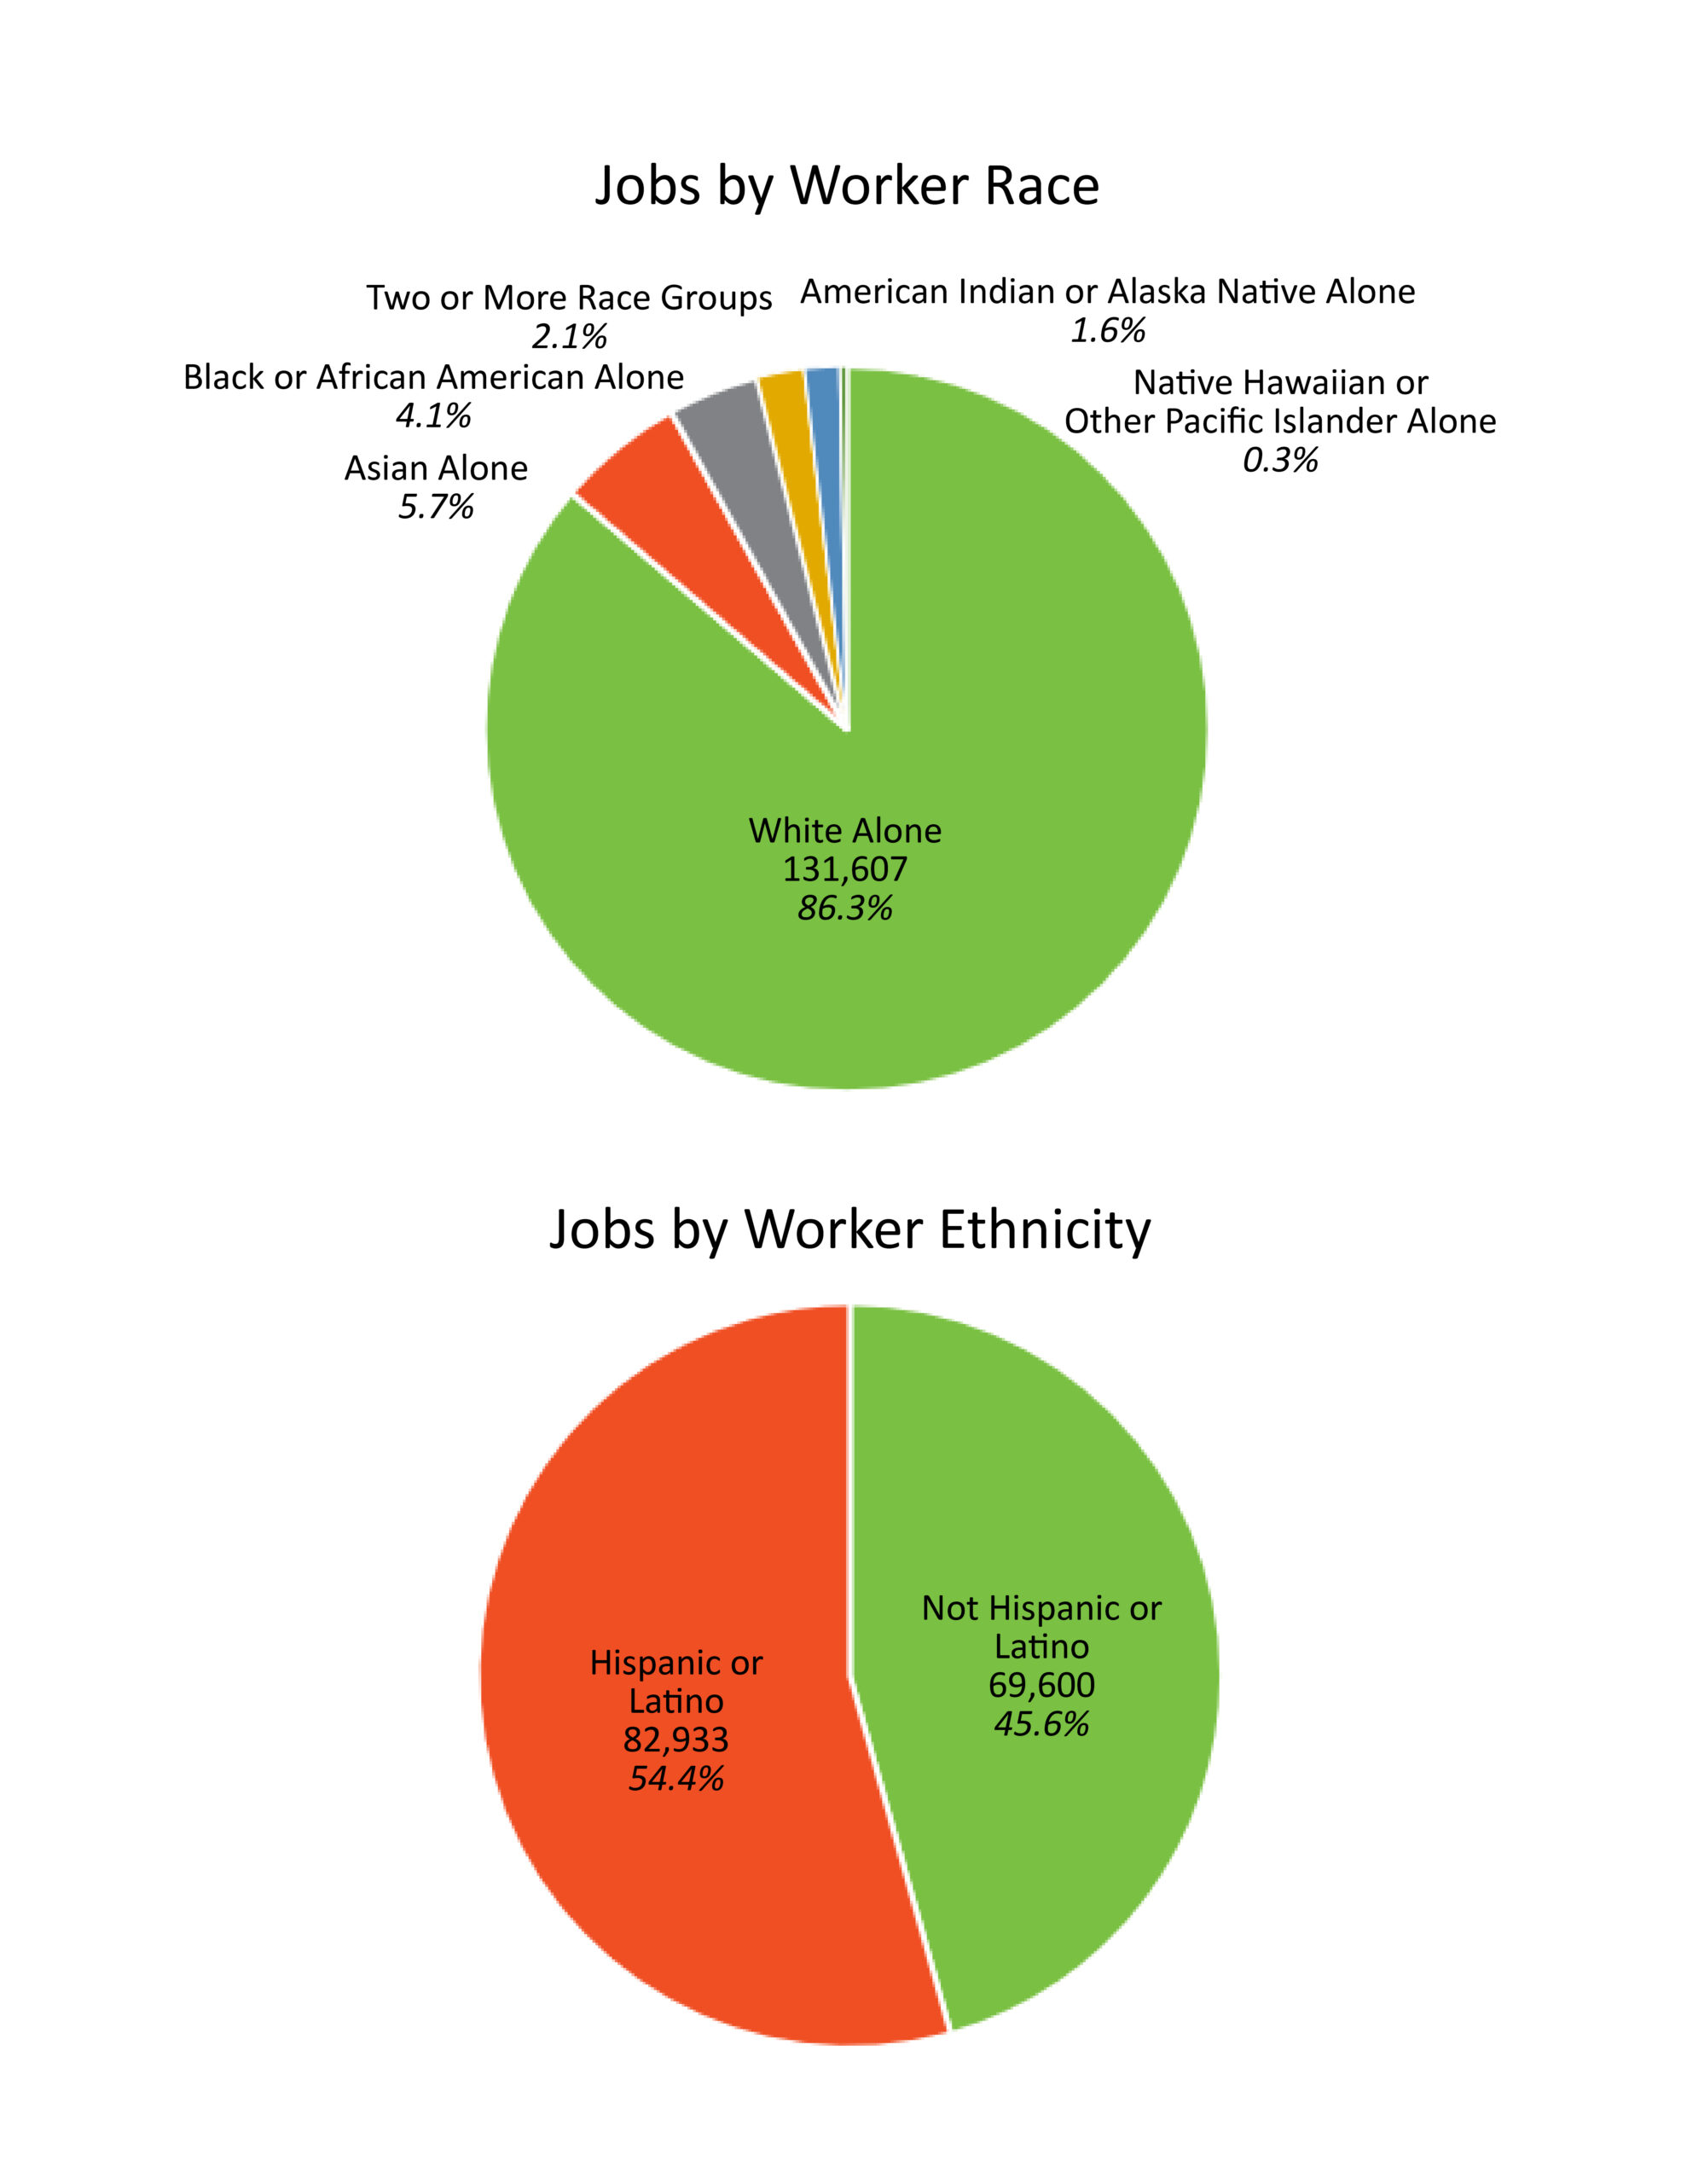 These data come from the American Community Survey. The US Census surveys Americans on a wide number of topics in the years between the decennial census. These are statistically updated every 3 years, so the latest data available is for 2021. While these may be a bit outdated, they still give a good impression of the distribution of workers who reside in the Coachella Valley. You can explore these data yourself on a very fun website called OnTheMap.


