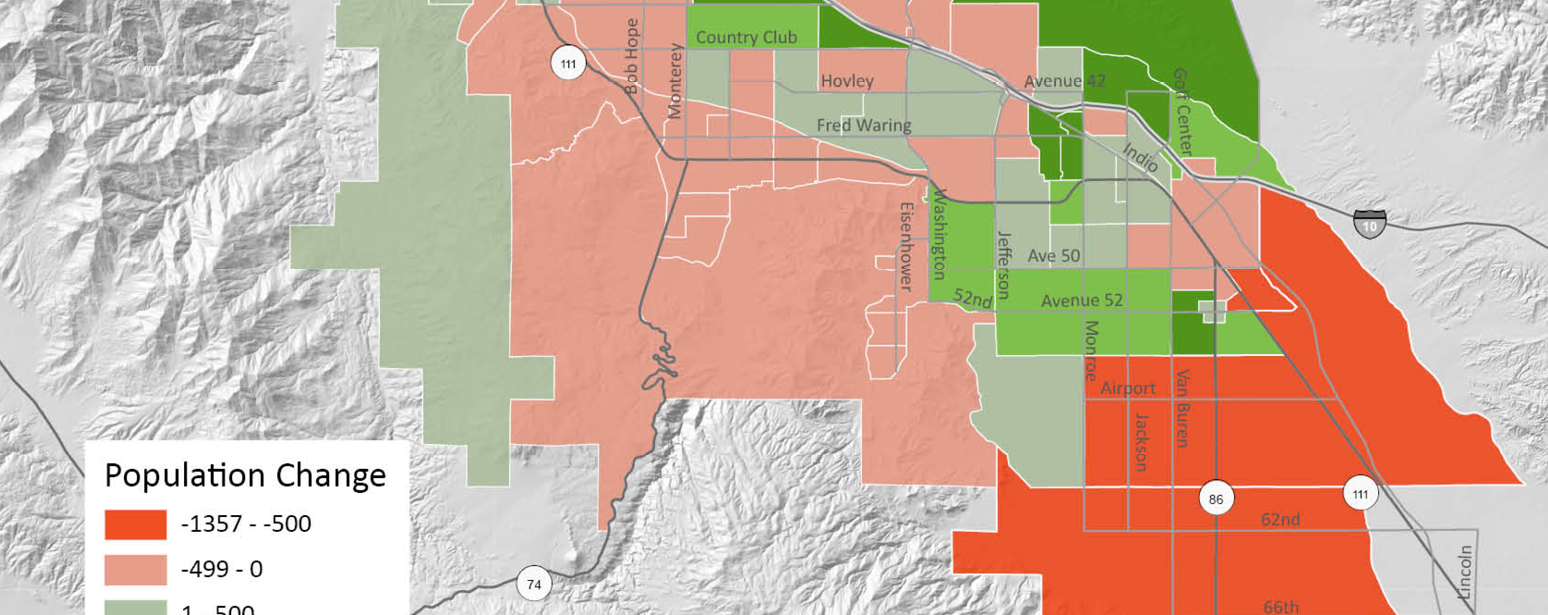
About David Robinson

David is the Director of Analytic Services for CVEP. David lives for travel, loves everything about maps, listens to too many podcasts, and spoils his cat. He has graduate degrees in Architecture and Geographic Information Systems and is passionate about gathering, organizing, and disseminating data about the Coachella Valley.

Predominate Race/Ethnicity in Coachella Valley Census Tracts

By |2021-09-30T10:31:01-07:00September 30th, 2021|Categories: Data Digest|Tags: , |

This week we continue our preliminary review of the 2020 Census results. Last week we compared 2010 and 2020 Census population and race/ethnicity data for each of the nine valley cities. Here we look at these data more granularly.  This map displays the predominant race/ethnicity for each valley census tract. We do have a diverse [...]

2010 to 2020 Census Comparison

By |2021-09-22T11:13:36-07:00September 22nd, 2021|Categories: Data Digest|Tags: , |

The US Census Bureau has finally released the 2020 redistricting data in a more accessible format. A primary purpose for each decennial census is providing the 50 states, the District of Columbia, and Puerto Rico with population counts to use in their redrawing of congressional and state legislative district boundaries. These data include population and [...]

Underemployment in Recent College Graduates

By |2021-09-08T16:18:12-07:00September 8th, 2021|Categories: Data Digest|Tags: , , , |

CVEP’s inimitable leader, Joe Wallace, frequently forwards the CVEP staff timely and persuasive articles about subjects pertaining to our regional economic development efforts. Recently, he sent a table displaying rankings of underemployment amongst recent college graduates. Note that these are not unemployed graduates, but underemployed graduates. If you are not making full use of your [...]

Taxable Sales Across the Nine Coachella Valley Cities

By |2021-08-24T15:07:47-07:00August 24th, 2021|Categories: Data Digest|Tags: , |

In my previous post, I compared three years of taxable sales in the 9 Coachella Valley cities to glimpse the effects of COVID-19 on local business revenue. But I only reported sales for all business outlets and a subset of retail and food services. The California Department of Tax and Fee Administration also provides sales [...]

Taxable Sales in the Coachella Valley

By |2021-08-10T16:37:11-07:00August 10th, 2021|Categories: Coronavirus, Data Digest|Tags: , , |

Soon we will be in the midst of our annual snowbird season. How could we have imagined, even a few months ago, that COVID would affect a second tourist season in the valley?  The rapid rise of the COVID delta variant has regrettably forestalled our anticipated recovery. With so much changing so quickly, it is [...]

Riverside County Zoning in the Coachella Valley

By |2021-08-05T14:42:47-07:00August 5th, 2021|Categories: Business Development, Data Digest|Tags: , , , |

We continue our exploration of land designation in the Coachella Valley with an overview of zoning. Typically, counties or municipalities establish codes that divide the land into “zones” to guide growth and development within their jurisdiction. Zones define compatible uses for land and establish regulations for how to develop those uses, e.g., manufacturing. Each city [...]

Federal Lands in the Coachella Valley

By |2021-07-27T14:27:05-07:00July 27th, 2021|Categories: Data Digest|Tags: , , |

I recently returned from a wonderful trip to Alaska. One of the statistics about this superlative state that intrigued me was that 62% (223.8 million acres) of its area is comprised of federally owned land. That got me curious about how much of the lands in our area are federally owned. Well, it turns out [...]

2020 Presidential Election Results in the Coachella Valley – by Precinct

By |2021-07-14T17:20:32-07:00July 14th, 2021|Categories: Data Digest|Tags: , |

I am sure many of us do not want to relive the 2020 Presidential campaign and election. But here we go. I have mapped precinct-level Presidential election results obtained from the New York Times. The map shows precincts where Biden or Trump won, and by what proportion of total votes. Biden prevailed in 105 precincts, [...]

Working From Home – The New Paradigm?

By |2021-06-29T17:43:51-07:00June 29th, 2021|Categories: Data Digest|Tags: , |

The COVID pandemic upended the nation’s workforce. Some were fortunate to transition to working from home and kept their positions and wages throughout the pandemic lockdowns. Others were not so privileged. A Pew Research report found unsurprisingly that 90% of those who lost their jobs in February and March of 2020 were in positions that [...]

The Working Age Population of the Coachella Valley

By |2021-06-24T22:09:56-07:00June 23rd, 2021|Categories: Data Digest|Tags: , , |

You can’t seem to open a newspaper or listen to the news lately without hearing a story about employers having a hard time finding new employees. Despite a resurging economy and countless job openings, many openings remain unfilled. In fact, the New York Times reports that there are more job openings this spring than before [...]

Go to Top