New US Congressional District Boundaries for the Coachella Valley

By |2022-01-04T17:43:56-08:00January 4th, 2022|Categories: Data Digest|Tags: , , |

Happy New Year everyone! Not only do we have a new year, but we also now have new voting districts. On Monday, December 20, California's redistricting commission approved the final redistricting map. Because of California's slower population growth in the last ten years, we now have 52 Congressional Districts, one less than previous.  But despite [...]

Non-primary Residence Study for the Coachella Valley

By |2021-12-07T17:33:11-08:00December 7th, 2021|Categories: Data Digest|Tags: , , |

Back in the spring of this year, Visit Greater Palm Springs reached out to us. They were updating their original 2017 Non-Primary Residence by Location of Owner study and asked us to be part of the team. The study analyzes Riverside County Assessor Property data. A list of residential properties with different mailing and property [...]

2020 Census: Census Tract Population Change

By |2021-11-18T18:13:43-08:00November 18th, 2021|Categories: Data Digest|Tags: , , , |

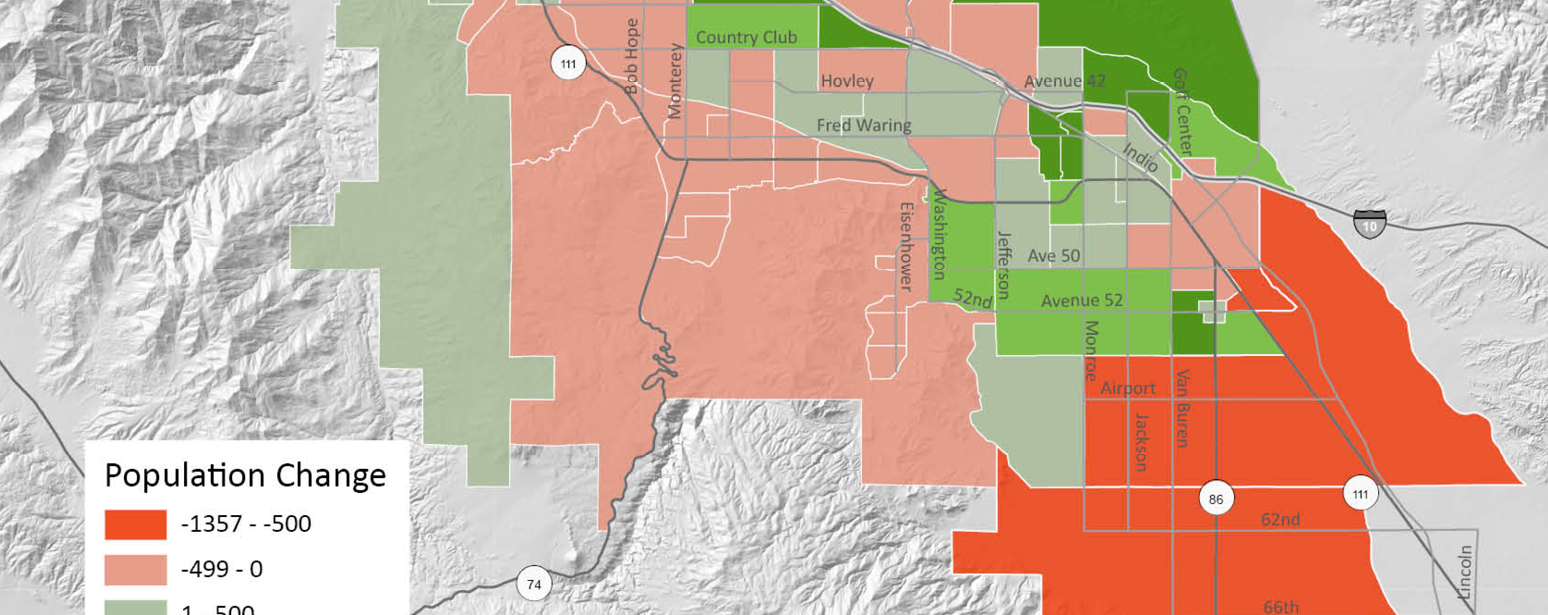
Today I write this blog in honor of this morning's big event, our annual Economic Summit. The 17th Annual Greater Palm Springs Summit took place this morning at 9 am. You can still catch the proceedings here.  The theme was "Pursuit."  Our featured speakers discussed the central theme of a committed regional strategy for coming [...]

2020 Census: Population Change by City

By |2021-11-16T14:23:30-08:00November 16th, 2021|Categories: Data Digest|Tags: , , |

We continue our exploration of the 2020 Census population counts. Here we look at the change in population in the nine Coachella Valley cities from the 2010 census to the 2020 census. Overall, the combined nine Coachella Valley cities saw a 6.8% increase in population. Desert Hot Springs saw the highest increase, 25.3%, with Indio [...]

2020 Census: New Coachella Valley Census Tracts

By |2021-11-15T14:35:05-08:00November 15th, 2021|Categories: Data Digest|Tags: , , |

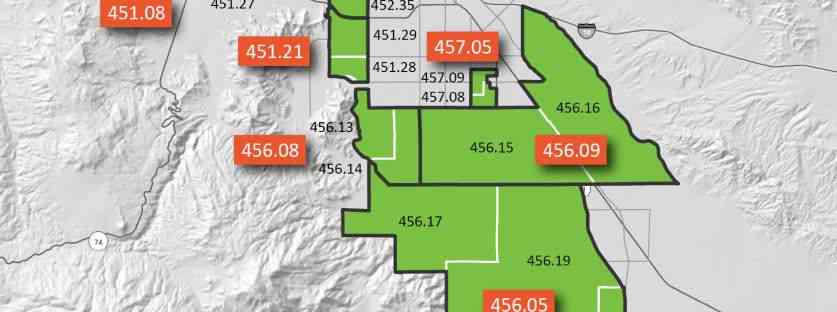
The US Constitution obligates the US Census Bureau to administer a nationwide census every ten years. In preparation, the bureau reviews previous census tract boundaries. When a tract's population grows to over 8,000 persons, it may be split into two or more smaller census tracts. Oppositely, if the population in adjacent tracts drastically declines they [...]

COVID Case Rates: Last Year’s Economic Summit compared to this year’s

By |2021-11-03T07:31:48-07:00November 3rd, 2021|Categories: Data Digest|Tags: , |

This time of year is bustling at CVEP as we prepare for our annual Summit. Last year, as we entered our 8th month of COVID lockdowns, we had to switch gears and host a virtual summit. Back then we never would have believed that a new variant - Delta, would emerge and return us to [...]

Leisure and Hospitality Workers quit their jobs at a record pace

By |2021-10-15T18:22:09-07:00October 15th, 2021|Categories: Data Digest|Tags: , , |

The Bureau of Labor Statistics reports that nationally, workers in the Leisure and Hospitality sector are quitting their jobs at a record pace. In May alone, 5.3% quit, a new record for this sector and twice the national average for all industries. As we note with regularity, the Coachella Valley is over-reliant on the Leisure [...]

2020 Census Self-Report Rates in the Coachella Valley

By |2021-10-06T14:26:32-07:00October 6th, 2021|Categories: Data Digest|Tags: , , |

While pouring myself a cup of coffee this morning a story on the radio caught my attention. The number of census respondents who identified with more than one racial group increased 276% from the last census. The NPR story noted three main factors behind this substantial increase. More children are being born to parents who [...]

Predominate Race/Ethnicity in Coachella Valley Census Tracts

By |2021-09-30T10:31:01-07:00September 30th, 2021|Categories: Data Digest|Tags: , |

This week we continue our preliminary review of the 2020 Census results. Last week we compared 2010 and 2020 Census population and race/ethnicity data for each of the nine valley cities. Here we look at these data more granularly.  This map displays the predominant race/ethnicity for each valley census tract. We do have a diverse [...]

2010 to 2020 Census Comparison

By |2021-09-22T11:13:36-07:00September 22nd, 2021|Categories: Data Digest|Tags: , |

The US Census Bureau has finally released the 2020 redistricting data in a more accessible format. A primary purpose for each decennial census is providing the 50 states, the District of Columbia, and Puerto Rico with population counts to use in their redrawing of congressional and state legislative district boundaries. These data include population and [...]

Go to Top