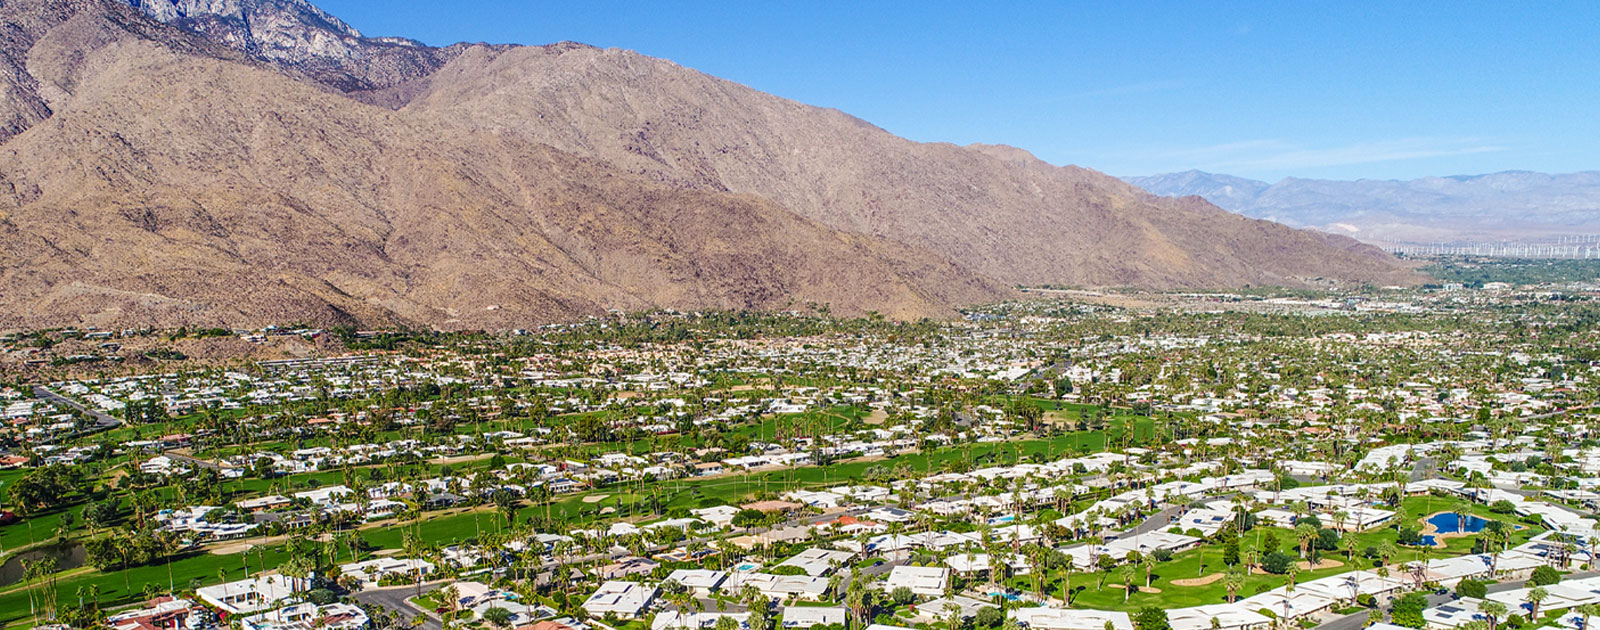
1950 Census – Coachella Valley Population

By |2022-04-19T16:05:55-07:00April 19th, 2022|Categories: Data Digest|Tags: , |

It wasn’t April fools! On April 1 the US Census Bureau released 1950 Census records. After 72 years have passed, the Census releases all answers to previously secret census forms. These handwritten forms are now available for historians and curious relatives to explore. That made us wonder. What did the Coachella Valley look like at [...]

Population Growth in the Riverside-San Bernardino-Ontario MSA and Riverside County: July 2020 to July 2021

By |2022-03-29T18:28:24-07:00March 29th, 2022|Categories: Data Digest|Tags: , , , , |

Last week the US Census released their 2021 county and Metro/Micro population estimates. Nearly three-quarters of the nation’s counties had a natural decrease in population in 2021 from the year before. That is up substantially from 45.5% in 2019, and 55.5% in 2020. A natural decrease happens when more deaths than births occur. Of course, [...]

Population under 18 years old: The Distribution in the Coachella Valley

By |2022-03-16T09:08:30-07:00March 15th, 2022|Categories: Data Digest|Tags: , , , |

For today’s Data Digest, we take another look at some of the limited data that is currently available from the 2020 Census. We will start to see more data rolling out this summer. You can count on seeing that discussed in the Data Digest. This week we look at the distribution of residents in the [...]

Average Income for Workers in the Coachella Valley

By |2022-03-01T15:55:53-08:00March 1st, 2022|Categories: Data Digest|Tags: , , |

Today I am highlighting another graph from our recently published 2021 Greater Palm Springs Economic Report. We encourage everyone to download a free copy. This graph from page 44 of the report displays the income for workers for each major industry sector averaged for all jobs in that sector. For example, financial activities can include [...]

2020 Census – Diversity in the Coachella Valley

By |2022-02-15T15:51:06-08:00February 15th, 2022|Categories: Data Digest|Tags: , , |

In my last blog, I endeavored to clarify the misunderstandings about race and ethnicity. Today we expand this exploration to look at diversity. The US Census Bureau authors a Diversity Index (DI).  The DI is a measure of the probability that two people chosen at random will be from a different race or ethnicity group. [...]

Clarifying 2020 Census Data: Race and Ethnicity

By |2022-02-02T07:10:25-08:00February 2nd, 2022|Categories: Data Digest|Tags: , , , |

Data from the latest 2020 Census covering the distribution of race and ethnicity in the United States are some of the earliest to be published. The US Census collects responses about race and Hispanic origin based on standards set in 1997 by the U.S. Office of Management and Budget (OMB).  Many are understandably confused about [...]

College and Graduate Enrollment in the Coachella Valley

By |2022-01-27T13:32:59-08:00January 27th, 2022|Categories: Data Digest|Tags: , , |

Today we give you a preview of data you will find in our soon-to-be-published 2021 Greater Palm Springs Economic Report. Below is a sample of the nearly 50 tables and graphs to be found in the report. These resources cover a wide range of demographic and economic characteristics of the Coachella Valley. This graph displays [...]

Coachella Valley Annual Population Growth Mapped – 2000 to 2020

By |2022-01-18T17:45:59-08:00January 18th, 2022|Categories: Data Digest|Tags: , , |

Last week we examined a graph displaying the annual population growth rate from 1990 to 2021. Today we look at these data in maps. The first map shows the compound annual growth rates for Coachella Valley census block groups from 2000 to 2020 (utilizing the latest 2020 Census data). This rate represents a kind of [...]

Annual Population Growth: 1990 – 2021

By |2022-01-14T12:10:34-08:00January 14th, 2022|Categories: Data Digest|Tags: , |

In my last blog, we examined Congressional redistricting for the Coachella Valley. Because of disproportionate population growth in the Coachella Valley and the rest of Riverside County, our valley will now be split into two new congressional districts. Today we look at the underlying population trends that led to that split. As displayed on the [...]

New US Congressional District Boundaries for the Coachella Valley

By |2022-01-04T17:43:56-08:00January 4th, 2022|Categories: Data Digest|Tags: , , |

Happy New Year everyone! Not only do we have a new year, but we also now have new voting districts. On Monday, December 20, California's redistricting commission approved the final redistricting map. Because of California's slower population growth in the last ten years, we now have 52 Congressional Districts, one less than previous.  But despite [...]

Go to Top